Unknown entries from news log file:
First 2 / 2 lines (100.0%)
Log entries by program:
| Program name | Lines | %Lines | Size | %Size |
|---|---|---|---|---|
| innd | 5880 | 91.0% | 725.4 KB | 92.1% |
| nnrpd | 417 | 6.5% | 42.0 KB | 5.3% |
| inn | 168 | 2.6% | 20.3 KB | 2.6% |
| TOTAL: 3 | 6465 | 100.0% | 787.7 KB | 100.0% |
History cache:
| Reason | Count | %Count |
|---|---|---|
| Negative hits | 167 | 49.9% |
| Do not exist | 167 | 49.9% |
| Positive hits | 1 | 0.3% |
| Cache misses | 0 | 0.0% |
| TOTAL: 4 | 335 | 100.0% |
INND timer:
| Code region | Time | Pct | Invoked | Min(ms) | Avg(ms) | Max(ms) |
|---|---|---|---|---|---|---|
| article cancel | 00:00:00.000 | 0.0% | 0 | 0.000 | 0.000 | 0.000 |
| article cleanup | 00:00:00.001 | 0.0% | 168 | 0.000 | 0.006 | 0.111 |
| article logging | 00:00:00.005 | 0.0% | 168 | 0.000 | 0.030 | 1.000 |
| article parse | 00:00:00.003 | 0.0% | 339 | 0.000 | 0.009 | 0.500 |
| article write | 00:00:00.115 | 0.0% | 168 | 0.000 | 0.685 | 16.000 |
| data move | 00:00:00.001 | 0.0% | 173 | 0.000 | 0.006 | 0.143 |
| history grep | 00:00:00.000 | 0.0% | 0 | 0.000 | 0.000 | 0.000 |
| history lookup | 00:00:00.064 | 0.0% | 337 | 0.000 | 0.190 | 7.000 |
| history sync | 00:00:00.029 | 0.0% | 307 | 0.000 | 0.094 | 2.000 |
| history write | 00:00:00.062 | 0.0% | 168 | 0.000 | 0.369 | 29.000 |
| idle | 24:00:41.707 | 100.0% | 3868 | 11766.980 | 22347.908 | 27291.000 |
| nntp read | 00:00:00.009 | 0.0% | 1907 | 0.000 | 0.005 | 0.462 |
| overview write | 00:00:00.067 | 0.0% | 168 | 0.000 | 0.399 | 8.000 |
| perl filter | 00:00:00.000 | 0.0% | 168 | 0.000 | 0.000 | 0.000 |
| python filter | 00:00:00.041 | 0.0% | 337 | 0.000 | 0.122 | 2.000 |
| site send | 00:00:00.000 | 0.0% | 0 | 0.000 | 0.000 | 0.000 |
| TOTAL: 24:00:42.892 | 24:00:42.104 | 100.0% | - | - | - | - |
nnrpd timer:
| Code region | Time | Pct | Invoked | Min(ms) | Avg(ms) | Max(ms) |
|---|---|---|---|---|---|---|
| idle | 01:13:01.006 | 99.6% | 381 | 127.000 | 11498.703 | 20739.793 |
| newnews | 00:00:00.000 | 0.0% | 0 | 0.000 | 0.000 | 0.000 |
| nntpwrite | 00:00:00.027 | 0.0% | 794 | 0.000 | 0.034 | 0.077 |
| TOTAL: 01:13:17.884 | 01:13:01.033 | 99.6% | - | - | - | - |
Control commands to INND:
| Command | Number |
|---|---|
| flush | 144 |
| flushlogs | 2 |
| go | 2 |
| logmode | 2 |
| lowmark | 1 |
| mode | 149 |
| name | 2 |
| pause | 2 |
| paused | 2 |
| reload | 2 |
| reserve | 2 |
| TOTAL: 11 | 310 |
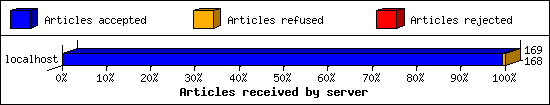
Incoming Feeds (INN):
| Server | Connects | Offered | Taken | Refused | Reject | %Accpt | Elapsed | |
|---|---|---|---|---|---|---|---|---|
| 1 | localhost | 1566 | 169 | 168 | 1 | 0 | 99% | 00:00:02 |
| TOTAL: 1 | 1566 | 169 | 168 | 1 | 0 | 99% | 00:00:02 | |
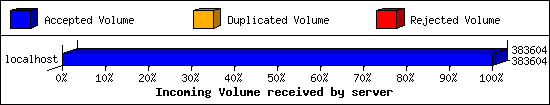
Incoming Volume (INN):
| Server | AcceptVol | DupVol | RejVol | TotalVol | %Acc | Vol/Art | |
|---|---|---|---|---|---|---|---|
| 1 | localhost | 374.6 KB | 0.0 KB | 0.0 KB | 374.6 KB | 100% | 2.2 KB |
| TOTAL: 1 | 374.6 KB | 0.0 KB | 0.0 KB | 374.6 KB | 100% | 2.2 KB | |
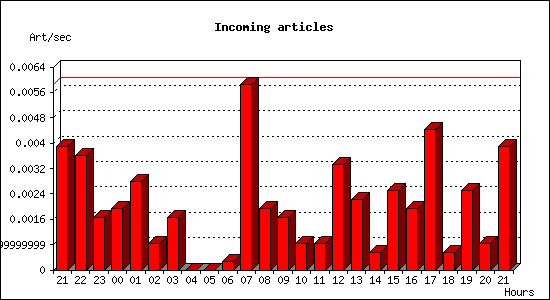
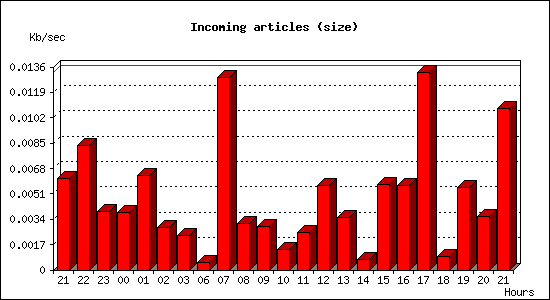
Incoming articles:
| Date | Articles | %Arts | Art/sec | Size | %Size | KB/sec |
|---|---|---|---|---|---|---|
| Dec 26 21:30:02 - 21:59:59 | 7 | 4.2% | 0.00 | 11.0 KB | 0.0% | 0.01 |
| Dec 26 22:00:00 - 22:59:59 | 13 | 7.7% | 0.00 | 30.1 KB | 0.0% | 0.01 |
| Dec 26 23:00:00 - 23:59:59 | 6 | 3.6% | 0.00 | 14.1 KB | 4.0% | 0.00 |
| Dec 27 00:00:00 - 00:59:59 | 7 | 4.2% | 0.00 | 13.9 KB | 3.9% | 0.00 |
| Dec 27 01:00:00 - 01:59:59 | 10 | 6.0% | 0.00 | 22.8 KB | 6.4% | 0.01 |
| Dec 27 02:00:00 - 02:59:59 | 3 | 1.8% | 0.00 | 10.2 KB | 2.9% | 0.00 |
| Dec 27 03:00:00 - 03:59:59 | 6 | 3.6% | 0.00 | 8.4 KB | 2.4% | 0.00 |
| Dec 27 04:00:00 - 04:59:59 | 0 | 0.0% | 0.00 | 0.0 KB | 0.0% | 0.00 |
| Dec 27 05:00:00 - 05:59:59 | 0 | 0.0% | 0.00 | 0.0 KB | 0.0% | 0.00 |
| Dec 27 06:00:00 - 06:59:59 | 1 | 0.6% | 0.00 | 1.7 KB | 0.5% | 0.00 |
| Dec 27 07:00:00 - 07:59:59 | 21 | 12.5% | 0.01 | 46.4 KB | 13.1% | 0.01 |
| Dec 27 08:00:00 - 08:59:59 | 7 | 4.2% | 0.00 | 11.1 KB | 3.1% | 0.00 |
| Dec 27 09:00:00 - 09:59:59 | 6 | 3.6% | 0.00 | 10.6 KB | 3.0% | 0.00 |
| Dec 27 10:00:00 - 10:59:59 | 3 | 1.8% | 0.00 | 5.1 KB | 1.4% | 0.00 |
| Dec 27 11:00:00 - 11:59:59 | 3 | 1.8% | 0.00 | 9.0 KB | 2.5% | 0.00 |
| Dec 27 12:00:00 - 12:59:59 | 12 | 7.1% | 0.00 | 20.4 KB | 5.8% | 0.01 |
| Dec 27 13:00:00 - 13:59:59 | 8 | 4.8% | 0.00 | 12.8 KB | 3.6% | 0.00 |
| Dec 27 14:00:00 - 14:59:59 | 2 | 1.2% | 0.00 | 2.6 KB | 0.7% | 0.00 |
| Dec 27 15:00:00 - 15:59:59 | 9 | 5.4% | 0.00 | 20.5 KB | 5.8% | 0.01 |
| Dec 27 16:00:00 - 16:59:59 | 7 | 4.2% | 0.00 | 20.5 KB | 5.8% | 0.01 |
| Dec 27 17:00:00 - 17:59:59 | 16 | 9.5% | 0.00 | 47.6 KB | 13.4% | 0.01 |
| Dec 27 18:00:00 - 18:59:59 | 2 | 1.2% | 0.00 | 3.4 KB | 1.0% | 0.00 |
| Dec 27 19:00:00 - 19:59:59 | 9 | 5.4% | 0.00 | 19.8 KB | 5.6% | 0.01 |
| Dec 27 20:00:00 - 20:59:59 | 3 | 1.8% | 0.00 | 13.0 KB | 3.7% | 0.00 |
| Dec 27 21:00:00 - 21:30:02 | 7 | 4.2% | 0.00 | 19.6 KB | 5.5% | 0.01 |
| TOTAL: 24:00:00 | 168 | 100.0% | 0.00 | 354.1 KB | 100.0% | 0.00 |
NNRP readership statistics:
| System | Conn | Arts | Size | Groups | Post | Rej | Elapsed | |
|---|---|---|---|---|---|---|---|---|
| 1 | 104.152.52.208 | 1 | 0 | 0.0 KB | 0 | 0 | 0 | 00:00:10 |
| 2 | 104.152.52.10 | 1 | 0 | 0.0 KB | 0 | 0 | 0 | 00:00:00 |
| 3 | 104.152.52.56 | 1 | 0 | 0.0 KB | 0 | 0 | 0 | 00:00:00 |
| 4 | 47.236.227.77 | 2 | 0 | 0.0 KB | 0 | 0 | 0 | 00:00:19 |
| 5 | scanner-08.ch1.censys-scanner.com | 1 | 0 | 0.0 KB | 0 | 0 | 0 | 00:00:00 |
| 6 | 2a02:e840::41c1:a081:1eb6:d08b | 8 | 0 | 0.0 KB | 0 | 0 | 0 | 01:12:44 |
| 7 | 104.152.52.59 | 1 | 0 | 0.0 KB | 0 | 0 | 0 | 00:00:00 |
| 8 | novel.monitoring.internet-measurement.com | 1 | 0 | 0.0 KB | 0 | 0 | 0 | 00:00:02 |
| TOTAL: 8 | 16 | 0 | 0.0 KB | 0 | 0 | 0 | 01:13:17 | |
NNRP readership statistics (by domain):
| System | Conn | Arts | Size | Groups | Post | Rej | Elapsed | |
|---|---|---|---|---|---|---|---|---|
| 1 | *.monitoring.internet-measurement.com | 1 | 0 | 0.0 KB | 0 | 0 | 0 | 00:00:02 |
| 2 | ? | 8 | 0 | 0.0 KB | 0 | 0 | 0 | 01:12:44 |
| 3 | unresolved | 6 | 0 | 0.0 KB | 0 | 0 | 0 | 00:00:30 |
| 4 | *.ch1.censys-scanner.com | 1 | 0 | 0.0 KB | 0 | 0 | 0 | 00:00:00 |
| TOTAL: 4 | 16 | 0 | 0.0 KB | 0 | 0 | 0 | 01:13:17 | |
NNRP auth users [Top 20]:
| User | Conn |
|---|---|
| denis | 8 |
| TOTAL: 1 | 8 |
NNRP total resource statistics [Top 20]:
| System | User(ms) | System(ms) | Idle(ms) | Elapsed |
|---|---|---|---|---|
| 2a02:e840::41c1:a081:1eb6:d08b | 0.076 | 0.085 | 0.040 | 01:12:44 |
| 47.236.227.77 | 0.018 | 0.009 | 0.000 | 00:00:19 |
| 104.152.52.208 | 0.004 | 0.007 | 0.000 | 00:00:10 |
| novel.monitoring.internet-measurement.com | 0.006 | 0.006 | 0.000 | 00:00:02 |
| scanner-08.ch1.censys-scanner.com | 0.018 | 0.007 | 0.000 | 00:00:00 |
| 104.152.52.10 | 0.005 | 0.005 | 0.000 | 00:00:00 |
| 104.152.52.56 | 0.005 | 0.005 | 0.000 | 00:00:00 |
| 104.152.52.59 | 0.007 | 0.003 | 0.000 | 00:00:00 |
| ? | 0.020 | 0.009 | 0.000 | 00:00:00 |
| TOTAL: 9 | 0.159 | 0.136 | 0.040 | 01:13:17 |
NNRP gethostbyaddr failures [Top 20]:
| System | Conn |
|---|---|
| ? (can't getpeername) | 3 |
| TOTAL: 1 | 3 |
NNRP unrecognized commands (by host):
| System | Conn |
|---|---|
| scanner-08.ch1.censys-scanner.com | 1 |
| TOTAL: 1 | 1 |
NNRP unrecognized commands (by command):
| Command | Count |
|---|---|
| EHLO www.censys.io | 1 |
| TOTAL: 1 | 1 |
NNRP client timeouts [Top 20]:
| System | Conn | Peer |
|---|---|---|
| 2a02:e840::41c1:a081:1eb6:d08b | 4 | 0 |
| TOTAL: 1 | 4 | 0 |