Log entries by program:
| Program name | Lines | %Lines | Size | %Size |
|---|---|---|---|---|
| innd | 6100 | 94.6% | 753.5 KB | 94.8% |
| inn | 294 | 4.6% | 35.2 KB | 4.4% |
| nnrpd | 54 | 0.8% | 5.9 KB | 0.7% |
| TOTAL: 3 | 6448 | 100.0% | 794.6 KB | 100.0% |
History cache:
| Reason | Count | %Count |
|---|---|---|
| Do not exist | 294 | 50.0% |
| Negative hits | 294 | 50.0% |
| Positive hits | 0 | 0.0% |
| Cache misses | 0 | 0.0% |
| TOTAL: 4 | 588 | 100.0% |
INND timer:
| Code region | Time | Pct | Invoked | Min(ms) | Avg(ms) | Max(ms) |
|---|---|---|---|---|---|---|
| article cancel | 00:00:00.000 | 0.0% | 0 | 0.000 | 0.000 | 0.000 |
| article cleanup | 00:00:00.001 | 0.0% | 298 | 0.000 | 0.003 | 0.500 |
| article logging | 00:00:00.011 | 0.0% | 298 | 0.000 | 0.037 | 1.000 |
| article parse | 00:00:00.005 | 0.0% | 604 | 0.000 | 0.008 | 0.167 |
| article write | 00:00:00.228 | 0.0% | 298 | 0.000 | 0.765 | 31.500 |
| data move | 00:00:00.000 | 0.0% | 310 | 0.000 | 0.000 | 0.000 |
| history grep | 00:00:00.000 | 0.0% | 0 | 0.000 | 0.000 | 0.000 |
| history lookup | 00:00:00.109 | 0.0% | 596 | 0.000 | 0.183 | 2.000 |
| history sync | 00:00:00.073 | 0.0% | 303 | 0.000 | 0.241 | 5.000 |
| history write | 00:00:00.095 | 0.0% | 298 | 0.000 | 0.319 | 4.500 |
| idle | 24:00:41.494 | 100.0% | 4265 | 7503.663 | 20267.642 | 27288.864 |
| nntp read | 00:00:00.025 | 0.0% | 2245 | 0.000 | 0.011 | 0.429 |
| overview write | 00:00:00.155 | 0.0% | 298 | 0.000 | 0.520 | 7.500 |
| perl filter | 00:00:00.000 | 0.0% | 298 | 0.000 | 0.000 | 0.000 |
| python filter | 00:00:00.061 | 0.0% | 596 | 0.000 | 0.102 | 1.500 |
| site send | 00:00:00.000 | 0.0% | 0 | 0.000 | 0.000 | 0.000 |
| TOTAL: 24:00:43.114 | 24:00:42.257 | 100.0% | - | - | - | - |
nnrpd timer:
| Code region | Time | Pct | Invoked | Min(ms) | Avg(ms) | Max(ms) |
|---|---|---|---|---|---|---|
| idle | 00:00:12.205 | 89.9% | 12 | 23.500 | 1017.083 | 9417.000 |
| newnews | 00:00:00.000 | 0.0% | 0 | 0.000 | 0.000 | 0.000 |
| nntpwrite | 00:00:00.000 | 0.0% | 28 | 0.000 | 0.000 | 0.000 |
| TOTAL: 00:00:13.576 | 00:00:12.205 | 89.9% | - | - | - | - |
Control commands to INND:
| Command | Number |
|---|---|
| flush | 144 |
| flushlogs | 2 |
| go | 2 |
| logmode | 2 |
| lowmark | 1 |
| mode | 149 |
| name | 3 |
| pause | 2 |
| paused | 2 |
| reload | 2 |
| reserve | 2 |
| TOTAL: 11 | 311 |
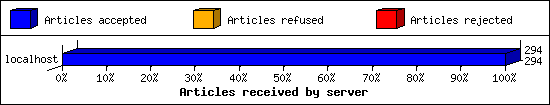
Incoming Feeds (INN):
| Server | Connects | Offered | Taken | Refused | Reject | %Accpt | Elapsed | |
|---|---|---|---|---|---|---|---|---|
| 1 | localhost | 1639 | 294 | 294 | 0 | 0 | 100% | 00:00:02 |
| TOTAL: 1 | 1639 | 294 | 294 | 0 | 0 | 100% | 00:00:02 | |
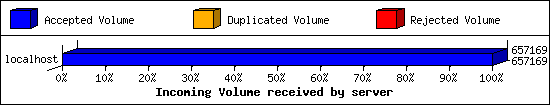
Incoming Volume (INN):
| Server | AcceptVol | DupVol | RejVol | TotalVol | %Acc | Vol/Art | |
|---|---|---|---|---|---|---|---|
| 1 | localhost | 641.8 KB | 0.0 KB | 0.0 KB | 641.8 KB | 100% | 2.2 KB |
| TOTAL: 1 | 641.8 KB | 0.0 KB | 0.0 KB | 641.8 KB | 100% | 2.2 KB | |
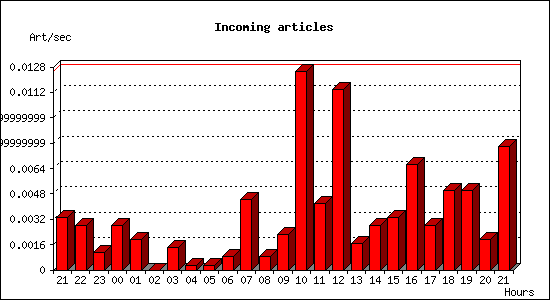
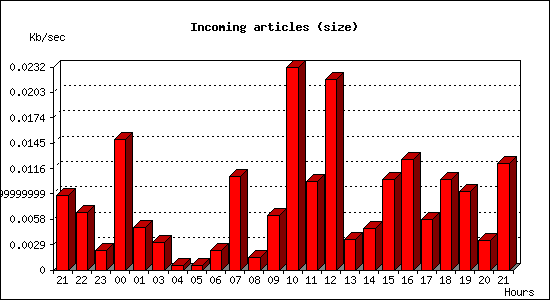
Incoming articles:
| Date | Articles | %Arts | Art/sec | Size | %Size | KB/sec |
|---|---|---|---|---|---|---|
| Dec 28 21:30:02 - 21:59:59 | 6 | 2.0% | 0.00 | 15.3 KB | 0.0% | 0.01 |
| Dec 28 22:00:00 - 22:59:59 | 10 | 3.4% | 0.00 | 23.5 KB | 19.7% | 0.01 |
| Dec 28 23:00:00 - 23:59:59 | 4 | 1.4% | 0.00 | 7.9 KB | 6.6% | 0.00 |
| Dec 29 00:00:00 - 00:59:59 | 10 | 3.4% | 0.00 | 53.6 KB | 45.0% | 0.01 |
| Dec 29 01:00:00 - 01:59:59 | 7 | 2.4% | 0.00 | 17.6 KB | 14.7% | 0.00 |
| Dec 29 02:00:00 - 02:59:59 | 0 | 0.0% | 0.00 | 0.0 KB | 0.0% | 0.00 |
| Dec 29 03:00:00 - 03:59:59 | 5 | 1.7% | 0.00 | 11.3 KB | 9.5% | 0.00 |
| Dec 29 04:00:00 - 04:59:59 | 1 | 0.3% | 0.00 | 1.8 KB | 1.5% | 0.00 |
| Dec 29 05:00:00 - 05:59:59 | 1 | 0.3% | 0.00 | 1.7 KB | 1.5% | 0.00 |
| Dec 29 06:00:00 - 06:59:59 | 3 | 1.0% | 0.00 | 8.1 KB | 6.8% | 0.00 |
| Dec 29 07:00:00 - 07:59:59 | 16 | 5.4% | 0.00 | 38.6 KB | 32.4% | 0.01 |
| Dec 29 08:00:00 - 08:59:59 | 3 | 1.0% | 0.00 | 5.1 KB | 4.3% | 0.00 |
| Dec 29 09:00:00 - 09:59:59 | 8 | 2.7% | 0.00 | 22.4 KB | 18.8% | 0.01 |
| Dec 29 10:00:00 - 10:59:59 | 45 | 15.3% | 0.01 | 83.3 KB | 69.8% | 0.02 |
| Dec 29 11:00:00 - 11:59:59 | 15 | 5.1% | 0.00 | 36.5 KB | 30.6% | 0.01 |
| Dec 29 12:00:00 - 12:59:59 | 41 | 13.9% | 0.01 | 78.3 KB | 65.7% | 0.02 |
| Dec 29 13:00:00 - 13:59:59 | 6 | 2.0% | 0.00 | 12.4 KB | 10.4% | 0.00 |
| Dec 29 14:00:00 - 14:59:59 | 10 | 3.4% | 0.00 | 17.3 KB | 14.5% | 0.00 |
| Dec 29 15:00:00 - 15:59:59 | 12 | 4.1% | 0.00 | 37.4 KB | 31.3% | 0.01 |
| Dec 29 16:00:00 - 16:59:59 | 24 | 8.2% | 0.01 | 45.6 KB | 38.2% | 0.01 |
| Dec 29 17:00:00 - 17:59:59 | 10 | 3.4% | 0.00 | 20.8 KB | 17.5% | 0.01 |
| Dec 29 18:00:00 - 18:59:59 | 18 | 6.1% | 0.01 | 37.1 KB | 31.1% | 0.01 |
| Dec 29 19:00:00 - 19:59:59 | 18 | 6.1% | 0.01 | 32.2 KB | 27.0% | 0.01 |
| Dec 29 20:00:00 - 20:59:59 | 7 | 2.4% | 0.00 | 12.0 KB | 10.0% | 0.00 |
| Dec 29 21:00:00 - 21:30:02 | 14 | 4.8% | 0.01 | 21.9 KB | 18.4% | 0.01 |
| TOTAL: 24:00:00 | 294 | 100.0% | 0.00 | 119.3 KB | 100.0% | 0.00 |
NNRP readership statistics:
| System | Conn | Arts | Size | Groups | Post | Rej | Elapsed | |
|---|---|---|---|---|---|---|---|---|
| 1 | 193.37.69.194 | 1 | 0 | 0.0 KB | 0 | 0 | 0 | 00:00:00 |
| 2 | 104.152.52.56 | 1 | 0 | 0.0 KB | 0 | 0 | 0 | 00:00:00 |
| 3 | 94.232.41.155 | 1 | 0 | 0.0 KB | 0 | 0 | 0 | 00:00:00 |
| 4 | 107.170.241.7 | 1 | 0 | 0.0 KB | 0 | 0 | 0 | 00:00:00 |
| 5 | 104.152.52.60 | 1 | 0 | 0.0 KB | 0 | 0 | 0 | 00:00:00 |
| 6 | 204.93.180.12 | 1 | 0 | 0.0 KB | 0 | 0 | 0 | 00:00:00 |
| 7 | 192.241.207.53 | 1 | 0 | 0.0 KB | 0 | 0 | 0 | 00:00:09 |
| 8 | 204.93.154.215 | 1 | 0 | 0.0 KB | 0 | 0 | 0 | 00:00:00 |
| 9 | monumental.monitoring.internet-measurement.com | 1 | 0 | 0.0 KB | 0 | 0 | 0 | 00:00:01 |
| TOTAL: 9 | 9 | 0 | 0.0 KB | 0 | 0 | 0 | 00:00:13 | |
NNRP readership statistics (by domain):
| System | Conn | Arts | Size | Groups | Post | Rej | Elapsed | |
|---|---|---|---|---|---|---|---|---|
| 1 | *.monitoring.internet-measurement.com | 1 | 0 | 0.0 KB | 0 | 0 | 0 | 00:00:01 |
| 2 | unresolved | 8 | 0 | 0.0 KB | 0 | 0 | 0 | 00:00:11 |
| TOTAL: 2 | 9 | 0 | 0.0 KB | 0 | 0 | 0 | 00:00:13 | |
NNRP total resource statistics [Top 20]:
| System | User(ms) | System(ms) | Idle(ms) | Elapsed |
|---|---|---|---|---|
| 192.241.207.53 | 0.006 | 0.005 | 0.000 | 00:00:09 |
| monumental.monitoring.internet-measurement.com | 0.007 | 0.006 | 0.000 | 00:00:01 |
| 107.170.241.7 | 0.004 | 0.010 | 0.000 | 00:00:00 |
| 204.93.180.12 | 0.008 | 0.004 | 0.000 | 00:00:00 |
| 204.93.154.215 | 0.007 | 0.006 | 0.000 | 00:00:00 |
| 104.152.52.60 | 0.004 | 0.006 | 0.000 | 00:00:00 |
| 104.152.52.56 | 0.005 | 0.004 | 0.000 | 00:00:00 |
| 193.37.69.194 | 0.006 | 0.008 | 0.000 | 00:00:00 |
| 94.232.41.155 | 0.008 | 0.005 | 0.000 | 00:00:00 |
| ? | 0.018 | 0.022 | 0.000 | 00:00:00 |
| TOTAL: 10 | 0.073 | 0.076 | 0.000 | 00:00:13 |
NNRP gethostbyaddr failures [Top 20]:
| System | Conn |
|---|---|
| ? (can't getpeername) | 4 |
| TOTAL: 1 | 4 |
NNRP unrecognized commands (by host):
| System | Conn |
|---|---|
| 94.232.41.155 | 1 |
| 193.37.69.194 | 1 |
| 107.170.241.7 | 1 |
| TOTAL: 3 | 3 |
NNRP unrecognized commands (by command):
| Command | Count |
|---|---|
| #003 | 2 |
| MGLNDD_37.46.134.137_119 | 1 |
| TOTAL: 2 | 3 |
NNRP client timeouts [Top 20]:
| System | Conn | Peer |
|---|---|---|
| 94.232.41.155 | 1 | 1 |
| 193.37.69.194 | 1 | 1 |
| TOTAL: 2 | 2 | 2 |