Unknown entries from news log file:
First 2 / 2 lines (100.0%)
Log entries by program:
| Program name | Lines | %Lines | Size | %Size |
|---|---|---|---|---|
| innd | 6141 | 94.6% | 759.0 KB | 94.8% |
| inn | 304 | 4.7% | 36.5 KB | 4.6% |
| nnrpd | 49 | 0.8% | 5.5 KB | 0.7% |
| TOTAL: 3 | 6494 | 100.0% | 801.0 KB | 100.0% |
History cache:
| Reason | Count | %Count |
|---|---|---|
| Negative hits | 302 | 50.0% |
| Do not exist | 302 | 50.0% |
| Positive hits | 0 | 0.0% |
| Cache misses | 0 | 0.0% |
| TOTAL: 4 | 604 | 100.0% |
INND timer:
| Code region | Time | Pct | Invoked | Min(ms) | Avg(ms) | Max(ms) |
|---|---|---|---|---|---|---|
| article cancel | 00:00:00.000 | 0.0% | 0 | 0.000 | 0.000 | 0.000 |
| article cleanup | 00:00:00.015 | 0.0% | 304 | 0.000 | 0.049 | 14.000 |
| article logging | 00:00:00.005 | 0.0% | 304 | 0.000 | 0.016 | 1.000 |
| article parse | 00:00:00.012 | 0.0% | 648 | 0.000 | 0.019 | 2.333 |
| article write | 00:00:00.225 | 0.0% | 304 | 0.000 | 0.740 | 38.000 |
| data move | 00:00:00.010 | 0.0% | 362 | 0.000 | 0.028 | 2.333 |
| history grep | 00:00:00.000 | 0.0% | 0 | 0.000 | 0.000 | 0.000 |
| history lookup | 00:00:00.113 | 0.0% | 608 | 0.000 | 0.186 | 7.000 |
| history sync | 00:00:00.095 | 0.0% | 299 | 0.000 | 0.318 | 7.000 |
| history write | 00:00:00.078 | 0.0% | 304 | 0.000 | 0.257 | 8.000 |
| idle | 24:00:39.864 | 100.0% | 4331 | 9379.969 | 19958.408 | 27288.000 |
| nntp read | 00:00:00.022 | 0.0% | 2302 | 0.000 | 0.010 | 1.000 |
| overview write | 00:00:00.280 | 0.0% | 304 | 0.000 | 0.921 | 143.000 |
| perl filter | 00:00:00.001 | 0.0% | 304 | 0.000 | 0.003 | 0.333 |
| python filter | 00:00:00.114 | 0.0% | 608 | 0.000 | 0.188 | 37.500 |
| site send | 00:00:00.000 | 0.0% | 0 | 0.000 | 0.000 | 0.000 |
| TOTAL: 24:00:41.628 | 24:00:40.834 | 100.0% | - | - | - | - |
nnrpd timer:
| Code region | Time | Pct | Invoked | Min(ms) | Avg(ms) | Max(ms) |
|---|---|---|---|---|---|---|
| idle | 00:00:03.322 | 73.9% | 11 | 97.500 | 302.000 | 1986.000 |
| newnews | 00:00:00.000 | 0.0% | 0 | 0.000 | 0.000 | 0.000 |
| nntpwrite | 00:00:00.000 | 0.0% | 27 | 0.000 | 0.000 | 0.000 |
| TOTAL: 00:00:04.497 | 00:00:03.322 | 73.9% | - | - | - | - |
Control commands to INND:
| Command | Number |
|---|---|
| flush | 144 |
| flushlogs | 2 |
| go | 2 |
| logmode | 2 |
| lowmark | 1 |
| mode | 149 |
| name | 2 |
| pause | 2 |
| paused | 2 |
| reload | 2 |
| reserve | 2 |
| TOTAL: 11 | 310 |
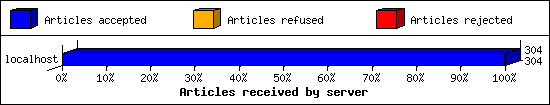
Incoming Feeds (INN):
| Server | Connects | Offered | Taken | Refused | Reject | %Accpt | Elapsed | |
|---|---|---|---|---|---|---|---|---|
| 1 | localhost | 1653 | 304 | 304 | 0 | 0 | 100% | 00:00:01 |
| TOTAL: 1 | 1653 | 304 | 304 | 0 | 0 | 100% | 00:00:01 | |
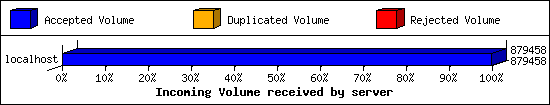
Incoming Volume (INN):
| Server | AcceptVol | DupVol | RejVol | TotalVol | %Acc | Vol/Art | |
|---|---|---|---|---|---|---|---|
| 1 | localhost | 858.8 KB | 0.0 KB | 0.0 KB | 858.8 KB | 100% | 2.8 KB |
| TOTAL: 1 | 858.8 KB | 0.0 KB | 0.0 KB | 858.8 KB | 100% | 2.8 KB | |
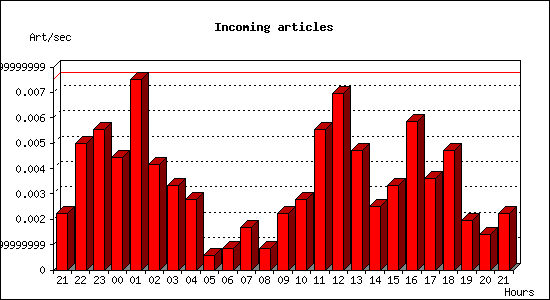
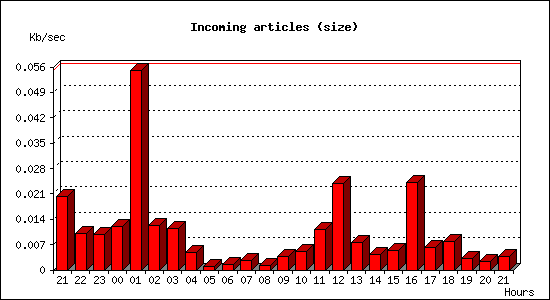
Incoming articles:
| Date | Articles | %Arts | Art/sec | Size | %Size | KB/sec |
|---|---|---|---|---|---|---|
| Jan 6 21:30:02 - 21:59:59 | 4 | 1.3% | 0.00 | 36.6 KB | 4.3% | 0.02 |
| Jan 6 22:00:00 - 22:59:59 | 18 | 5.9% | 0.01 | 36.6 KB | 4.3% | 0.01 |
| Jan 6 23:00:00 - 23:59:59 | 20 | 6.6% | 0.01 | 35.0 KB | 4.1% | 0.01 |
| Jan 7 00:00:00 - 00:59:59 | 16 | 5.3% | 0.00 | 43.0 KB | 5.0% | 0.01 |
| Jan 7 01:00:00 - 01:59:59 | 27 | 8.9% | 0.01 | 198.1 KB | 23.1% | 0.06 |
| Jan 7 02:00:00 - 02:59:59 | 15 | 4.9% | 0.00 | 44.3 KB | 5.2% | 0.01 |
| Jan 7 03:00:00 - 03:59:59 | 12 | 3.9% | 0.00 | 40.8 KB | 4.8% | 0.01 |
| Jan 7 04:00:00 - 04:59:59 | 10 | 3.3% | 0.00 | 17.3 KB | 2.0% | 0.00 |
| Jan 7 05:00:00 - 05:59:59 | 2 | 0.7% | 0.00 | 3.4 KB | 0.4% | 0.00 |
| Jan 7 06:00:00 - 06:59:59 | 3 | 1.0% | 0.00 | 5.5 KB | 0.6% | 0.00 |
| Jan 7 07:00:00 - 07:59:59 | 6 | 2.0% | 0.00 | 9.2 KB | 1.1% | 0.00 |
| Jan 7 08:00:00 - 08:59:59 | 3 | 1.0% | 0.00 | 4.3 KB | 0.5% | 0.00 |
| Jan 7 09:00:00 - 09:59:59 | 8 | 2.6% | 0.00 | 13.5 KB | 1.6% | 0.00 |
| Jan 7 10:00:00 - 10:59:59 | 10 | 3.3% | 0.00 | 18.5 KB | 2.2% | 0.01 |
| Jan 7 11:00:00 - 11:59:59 | 20 | 6.6% | 0.01 | 39.9 KB | 4.6% | 0.01 |
| Jan 7 12:00:00 - 12:59:59 | 25 | 8.2% | 0.01 | 85.7 KB | 10.0% | 0.02 |
| Jan 7 13:00:00 - 13:59:59 | 17 | 5.6% | 0.00 | 27.8 KB | 3.2% | 0.01 |
| Jan 7 14:00:00 - 14:59:59 | 9 | 3.0% | 0.00 | 15.0 KB | 1.7% | 0.00 |
| Jan 7 15:00:00 - 15:59:59 | 12 | 3.9% | 0.00 | 19.6 KB | 2.3% | 0.01 |
| Jan 7 16:00:00 - 16:59:59 | 21 | 6.9% | 0.01 | 86.8 KB | 10.1% | 0.02 |
| Jan 7 17:00:00 - 17:59:59 | 13 | 4.3% | 0.00 | 22.6 KB | 2.6% | 0.01 |
| Jan 7 18:00:00 - 18:59:59 | 17 | 5.6% | 0.00 | 28.1 KB | 3.3% | 0.01 |
| Jan 7 19:00:00 - 19:59:59 | 7 | 2.3% | 0.00 | 11.7 KB | 1.4% | 0.00 |
| Jan 7 20:00:00 - 20:59:59 | 5 | 1.6% | 0.00 | 8.7 KB | 1.0% | 0.00 |
| Jan 7 21:00:00 - 21:30:02 | 4 | 1.3% | 0.00 | 6.9 KB | 0.8% | 0.00 |
| TOTAL: 24:00:00 | 304 | 100.0% | 0.00 | 858.8 KB | 100.0% | 0.01 |
NNRP readership statistics:
| System | Conn | Arts | Size | Groups | Post | Rej | Elapsed | |
|---|---|---|---|---|---|---|---|---|
| 1 | 104.152.52.58 | 1 | 0 | 0.0 KB | 0 | 0 | 0 | 00:00:00 |
| 2 | 104.152.52.14 | 1 | 0 | 0.0 KB | 0 | 0 | 0 | 00:00:00 |
| 3 | excellent.monitoring.internet-measurement.com | 1 | 0 | 0.0 KB | 0 | 0 | 0 | 00:00:01 |
| 4 | 204.93.154.215 | 1 | 0 | 0.0 KB | 0 | 0 | 0 | 00:00:00 |
| 5 | 107.170.208.32 | 1 | 0 | 0.0 KB | 0 | 0 | 0 | 00:00:00 |
| 6 | scanner-09.ch1.censys-scanner.com | 1 | 0 | 0.0 KB | 0 | 0 | 0 | 00:00:00 |
| 7 | 104.152.52.3 | 1 | 0 | 0.0 KB | 0 | 0 | 0 | 00:00:00 |
| 8 | 104.152.52.10 | 1 | 0 | 0.0 KB | 0 | 0 | 0 | 00:00:00 |
| TOTAL: 8 | 8 | 0 | 0.0 KB | 0 | 0 | 0 | 00:00:04 | |
NNRP readership statistics (by domain):
| System | Conn | Arts | Size | Groups | Post | Rej | Elapsed | |
|---|---|---|---|---|---|---|---|---|
| 1 | unresolved | 6 | 0 | 0.0 KB | 0 | 0 | 0 | 00:00:01 |
| 2 | *.ch1.censys-scanner.com | 1 | 0 | 0.0 KB | 0 | 0 | 0 | 00:00:00 |
| 3 | *.monitoring.internet-measurement.com | 1 | 0 | 0.0 KB | 0 | 0 | 0 | 00:00:01 |
| TOTAL: 3 | 8 | 0 | 0.0 KB | 0 | 0 | 0 | 00:00:04 | |
NNRP total resource statistics [Top 20]:
| System | User(ms) | System(ms) | Idle(ms) | Elapsed |
|---|---|---|---|---|
| excellent.monitoring.internet-measurement.com | 0.002 | 0.009 | 0.000 | 00:00:01 |
| 107.170.208.32 | 0.004 | 0.007 | 0.000 | 00:00:00 |
| scanner-09.ch1.censys-scanner.com | 0.016 | 0.006 | 0.000 | 00:00:00 |
| 104.152.52.14 | 0.007 | 0.003 | 0.000 | 00:00:00 |
| 104.152.52.3 | 0.007 | 0.002 | 0.000 | 00:00:00 |
| 204.93.154.215 | 0.006 | 0.007 | 0.000 | 00:00:00 |
| 104.152.52.58 | 0.006 | 0.003 | 0.000 | 00:00:00 |
| 104.152.52.10 | 0.008 | 0.004 | 0.000 | 00:00:00 |
| ? | 0.026 | 0.022 | 0.000 | 00:00:00 |
| TOTAL: 9 | 0.082 | 0.063 | 0.000 | 00:00:04 |
NNRP gethostbyaddr failures [Top 20]:
| System | Conn |
|---|---|
| ? (can't getpeername) | 5 |
| TOTAL: 1 | 5 |
NNRP unrecognized commands (by host):
| System | Conn |
|---|---|
| scanner-09.ch1.censys-scanner.com | 1 |
| 107.170.208.32 | 1 |
| TOTAL: 2 | 2 |
NNRP unrecognized commands (by command):
| Command | Count |
|---|---|
| EHLO www.censys.io | 1 |
| MGLNDD_37.46.134.137_119 | 1 |
| TOTAL: 2 | 2 |