
Unknown entries from news log file:
First 2 / 2 lines (100.0%)
Log entries by program:
| Program name | Lines | %Lines | Size | %Size |
|---|---|---|---|---|
| innd | 6346 | 89.0% | 783.5 KB | 89.8% |
| nnrpd | 394 | 5.5% | 42.5 KB | 4.9% |
| inn | 387 | 5.4% | 46.5 KB | 5.3% |
| TOTAL: 3 | 7127 | 100.0% | 872.6 KB | 100.0% |
History cache:
| Reason | Count | %Count |
|---|---|---|
| Negative hits | 387 | 50.0% |
| Do not exist | 387 | 50.0% |
| Cache misses | 0 | 0.0% |
| Positive hits | 0 | 0.0% |
| TOTAL: 4 | 774 | 100.0% |
INND timer:
| Code region | Time | Pct | Invoked | Min(ms) | Avg(ms) | Max(ms) |
|---|---|---|---|---|---|---|
| article cancel | 00:00:00.000 | 0.0% | 0 | 0.000 | 0.000 | 0.000 |
| article cleanup | 00:00:00.001 | 0.0% | 389 | 0.000 | 0.003 | 1.000 |
| article logging | 00:00:00.011 | 0.0% | 389 | 0.000 | 0.028 | 1.000 |
| article parse | 00:00:00.006 | 0.0% | 802 | 0.000 | 0.007 | 0.167 |
| article write | 00:00:00.309 | 0.0% | 389 | 0.000 | 0.794 | 10.000 |
| data move | 00:00:00.004 | 0.0% | 424 | 0.000 | 0.009 | 0.300 |
| history grep | 00:00:00.000 | 0.0% | 0 | 0.000 | 0.000 | 0.000 |
| history lookup | 00:00:00.206 | 0.0% | 778 | 0.000 | 0.265 | 4.500 |
| history sync | 00:00:00.120 | 0.0% | 310 | 0.000 | 0.387 | 7.000 |
| history write | 00:00:00.120 | 0.0% | 389 | 0.000 | 0.308 | 5.333 |
| idle | 24:00:43.515 | 100.0% | 4771 | 6900.172 | 18118.532 | 27286.409 |
| nntp read | 00:00:00.017 | 0.0% | 2524 | 0.000 | 0.007 | 0.111 |
| overview write | 00:00:00.302 | 0.0% | 389 | 0.000 | 0.776 | 9.909 |
| perl filter | 00:00:00.000 | 0.0% | 389 | 0.000 | 0.000 | 0.000 |
| python filter | 00:00:00.058 | 0.0% | 778 | 0.000 | 0.075 | 2.500 |
| site send | 00:00:00.000 | 0.0% | 0 | 0.000 | 0.000 | 0.000 |
| TOTAL: 24:00:45.673 | 24:00:44.669 | 100.0% | - | - | - | - |
nnrpd timer:
| Code region | Time | Pct | Invoked | Min(ms) | Avg(ms) | Max(ms) |
|---|---|---|---|---|---|---|
| idle | 00:52:42.445 | 99.9% | 536 | 25.000 | 5900.084 | 57624.857 |
| newnews | 00:00:00.000 | 0.0% | 0 | 0.000 | 0.000 | 0.000 |
| nntpwrite | 00:00:00.029 | 0.0% | 10375 | 0.000 | 0.003 | 0.286 |
| readart | 00:00:00.040 | 0.0% | 217 | 0.000 | 0.184 | 0.667 |
| TOTAL: 00:52:46.520 | 00:52:42.514 | 99.9% | - | - | - | - |
Control commands to INND:
| Command | Number |
|---|---|
| flush | 145 |
| flushlogs | 2 |
| go | 2 |
| logmode | 2 |
| lowmark | 1 |
| mode | 149 |
| name | 2 |
| pause | 2 |
| paused | 2 |
| reload | 2 |
| reserve | 2 |
| TOTAL: 11 | 311 |
Incoming Feeds (INN):
| Server | Connects | Offered | Taken | Refused | Reject | %Accpt | Elapsed | |
|---|---|---|---|---|---|---|---|---|
| 1 | localhost | 1720 | 387 | 387 | 0 | 0 | 100% | 00:00:06 |
| TOTAL: 1 | 1720 | 387 | 387 | 0 | 0 | 100% | 00:00:06 | |
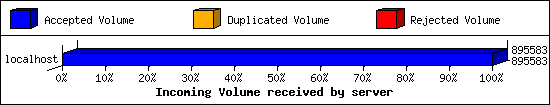
Incoming Volume (INN):
| Server | AcceptVol | DupVol | RejVol | TotalVol | %Acc | Vol/Art | |
|---|---|---|---|---|---|---|---|
| 1 | localhost | 874.6 KB | 0.0 KB | 0.0 KB | 874.6 KB | 100% | 2.3 KB |
| TOTAL: 1 | 874.6 KB | 0.0 KB | 0.0 KB | 874.6 KB | 100% | 2.3 KB | |
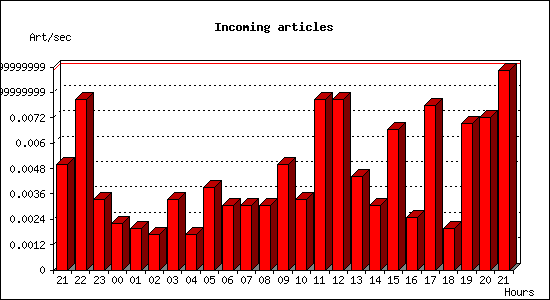
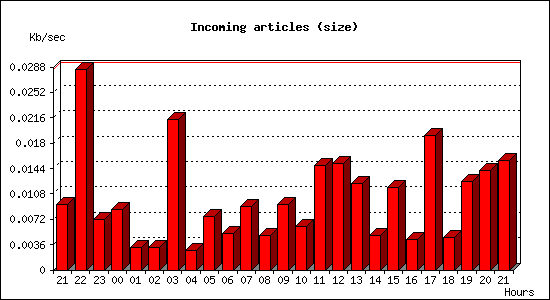
Incoming articles:
| Date | Articles | %Arts | Art/sec | Size | %Size | KB/sec |
|---|---|---|---|---|---|---|
| Jan 8 21:30:02 - 21:59:59 | 9 | 2.3% | 0.01 | 16.8 KB | 1.9% | 0.01 |
| Jan 8 22:00:00 - 22:59:59 | 29 | 7.5% | 0.01 | 102.4 KB | 11.7% | 0.03 |
| Jan 8 23:00:00 - 23:59:59 | 12 | 3.1% | 0.00 | 25.7 KB | 2.9% | 0.01 |
| Jan 9 00:00:00 - 00:59:59 | 8 | 2.1% | 0.00 | 30.7 KB | 3.5% | 0.01 |
| Jan 9 01:00:00 - 01:59:59 | 7 | 1.8% | 0.00 | 11.4 KB | 1.3% | 0.00 |
| Jan 9 02:00:00 - 02:59:59 | 6 | 1.6% | 0.00 | 11.7 KB | 1.3% | 0.00 |
| Jan 9 03:00:00 - 03:59:59 | 12 | 3.1% | 0.00 | 76.6 KB | 8.8% | 0.02 |
| Jan 9 04:00:00 - 04:59:59 | 6 | 1.6% | 0.00 | 10.2 KB | 1.2% | 0.00 |
| Jan 9 05:00:00 - 05:59:59 | 14 | 3.6% | 0.00 | 27.5 KB | 3.1% | 0.01 |
| Jan 9 06:00:00 - 06:59:59 | 11 | 2.8% | 0.00 | 18.7 KB | 2.1% | 0.01 |
| Jan 9 07:00:00 - 07:59:59 | 11 | 2.8% | 0.00 | 32.2 KB | 3.7% | 0.01 |
| Jan 9 08:00:00 - 08:59:59 | 11 | 2.8% | 0.00 | 17.9 KB | 2.0% | 0.00 |
| Jan 9 09:00:00 - 09:59:59 | 18 | 4.7% | 0.01 | 33.3 KB | 3.8% | 0.01 |
| Jan 9 10:00:00 - 10:59:59 | 12 | 3.1% | 0.00 | 22.3 KB | 2.5% | 0.01 |
| Jan 9 11:00:00 - 11:59:59 | 29 | 7.5% | 0.01 | 53.6 KB | 6.1% | 0.01 |
| Jan 9 12:00:00 - 12:59:59 | 29 | 7.5% | 0.01 | 54.4 KB | 6.2% | 0.02 |
| Jan 9 13:00:00 - 13:59:59 | 16 | 4.1% | 0.00 | 44.1 KB | 5.0% | 0.01 |
| Jan 9 14:00:00 - 14:59:59 | 11 | 2.8% | 0.00 | 17.9 KB | 2.0% | 0.00 |
| Jan 9 15:00:00 - 15:59:59 | 24 | 6.2% | 0.01 | 42.3 KB | 4.8% | 0.01 |
| Jan 9 16:00:00 - 16:59:59 | 9 | 2.3% | 0.00 | 15.6 KB | 1.8% | 0.00 |
| Jan 9 17:00:00 - 17:59:59 | 28 | 7.2% | 0.01 | 68.5 KB | 7.8% | 0.02 |
| Jan 9 18:00:00 - 18:59:59 | 7 | 1.8% | 0.00 | 16.4 KB | 1.9% | 0.00 |
| Jan 9 19:00:00 - 19:59:59 | 25 | 6.5% | 0.01 | 45.3 KB | 5.2% | 0.01 |
| Jan 9 20:00:00 - 20:59:59 | 26 | 6.7% | 0.01 | 51.1 KB | 5.8% | 0.01 |
| Jan 9 21:00:00 - 21:30:02 | 17 | 4.4% | 0.01 | 28.0 KB | 3.2% | 0.02 |
| TOTAL: 24:00:00 | 387 | 100.0% | 0.00 | 874.6 KB | 100.0% | 0.01 |
NNRP readership statistics:
| System | Conn | Arts | Size | Groups | Post | Rej | Elapsed | |
|---|---|---|---|---|---|---|---|---|
| 1 | 46.163.139.168 | 69 | 128 | 150.5 KB | 7 | 0 | 0 | 00:51:20 |
| TOTAL: 1 | 69 | 128 | 150.5 KB | 7 | 0 | 0 | 00:52:46 | |
NNRP readership statistics (by domain):
| System | Conn | Arts | Size | Groups | Post | Rej | Elapsed | |
|---|---|---|---|---|---|---|---|---|
| 1 | unresolved | 76 | 128 | 150.5 KB | 7 | 0 | 0 | 00:52:43 |
| 2 | *.monitoring.internet-measurement.com | 1 | 0 | 0.0 KB | 0 | 0 | 0 | 00:00:01 |
| 3 | *.ch1.censys-scanner.com | 1 | 0 | 0.0 KB | 0 | 0 | 0 | 00:00:01 |
| TOTAL: 3 | 78 | 128 | 150.5 KB | 7 | 0 | 0 | 00:52:46 | |
NNRP total resource statistics [Top 20]:
| System | User(ms) | System(ms) | Idle(ms) | Elapsed |
|---|---|---|---|---|
| 46.163.139.168 | 0.503 | 0.474 | 0.000 | 00:51:20 |
| 218.75.38.213 | 0.006 | 0.008 | 0.000 | 00:01:20 |
| intelligent.monitoring.internet-measurement.com | 0.007 | 0.003 | 0.000 | 00:00:01 |
| scanner-06.ch1.censys-scanner.com | 0.015 | 0.008 | 0.000 | 00:00:01 |
| 104.152.52.15 | 0.004 | 0.006 | 0.000 | 00:00:00 |
| 204.93.154.208 | 0.004 | 0.008 | 0.000 | 00:00:00 |
| 204.93.180.6 | 0.007 | 0.004 | 0.000 | 00:00:00 |
| 204.93.180.12 | 0.009 | 0.004 | 0.000 | 00:00:00 |
| 104.152.52.67 | 0.006 | 0.004 | 0.000 | 00:00:00 |
| 104.152.52.60 | 0.006 | 0.004 | 0.000 | 00:00:00 |
| ? | 0.033 | 0.031 | 0.000 | 00:00:00 |
| TOTAL: 11 | 0.600 | 0.554 | 0.000 | 00:52:46 |
Curious NNRP server explorers [Top 20]:
| System | Conn |
|---|---|
| 204.93.180.6 | 1 |
| 204.93.154.208 | 1 |
| intelligent.monitoring.internet-measurement.com | 1 |
| 218.75.38.213 | 1 |
| 204.93.180.12 | 1 |
| 104.152.52.67 | 1 |
| scanner-06.ch1.censys-scanner.com | 1 |
| 104.152.52.15 | 1 |
| 104.152.52.60 | 1 |
| TOTAL: 9 | 9 |
NNRP gethostbyaddr failures [Top 20]:
| System | Conn |
|---|---|
| ? (can't getpeername) | 6 |
| TOTAL: 1 | 6 |
NNRP unrecognized commands (by host):
| System | Conn |
|---|---|
| 218.75.38.213 | 1 |
| scanner-06.ch1.censys-scanner.com | 1 |
| TOTAL: 2 | 2 |
NNRP unrecognized commands (by command):
| Command | Count |
|---|---|
| EHLO www.censys.io | 1 |
| GET / HTTP/1.0 | 1 |
| TOTAL: 2 | 2 |
NNRP client timeouts [Top 20]:
| System | Conn | Peer |
|---|---|---|
| 218.75.38.213 | 2 | 0 |
| TOTAL: 1 | 2 | 0 |
Newsgroup request counts (by category):
| Category | Count | Pct | |
|---|---|---|---|
| 1 | fido7 | 128 | 100.0% |
| TOTAL: 1 | 128 | 100.0% | |
Newsgroup request counts (by newsgroup) [Top 100]:
| Newsgroup | Count | |
|---|---|---|
| 1 | fido7.ru.linux | 52 |
| 2 | fido7.hobbit.local | 26 |
| 3 | fido7.ru.fidonet.digest | 26 |
| 4 | fido7.su.hamradio | 22 |
| 5 | fido7.ru.fido.www | 2 |
| TOTAL: 5 | 128 | |