Log entries by program:
| Program name | Lines | %Lines | Size | %Size |
|---|---|---|---|---|
| innd | 5742 | 97.8% | 697.2 KB | 97.8% |
| inn | 93 | 1.6% | 11.1 KB | 1.6% |
| nnrpd | 37 | 0.6% | 4.3 KB | 0.6% |
| TOTAL: 3 | 5872 | 100.0% | 712.5 KB | 100.0% |
History cache:
| Reason | Count | %Count |
|---|---|---|
| Negative hits | 93 | 50.0% |
| Do not exist | 93 | 50.0% |
| Cache misses | 0 | 0.0% |
| Positive hits | 0 | 0.0% |
| TOTAL: 4 | 186 | 100.0% |
INND timer:
| Code region | Time | Pct | Invoked | Min(ms) | Avg(ms) | Max(ms) |
|---|---|---|---|---|---|---|
| article cancel | 00:00:00.000 | 0.0% | 0 | 0.000 | 0.000 | 0.000 |
| article cleanup | 00:00:00.005 | 0.0% | 95 | 0.000 | 0.053 | 0.333 |
| article logging | 00:00:00.012 | 0.0% | 95 | 0.000 | 0.126 | 1.111 |
| article parse | 00:00:00.008 | 0.0% | 210 | 0.000 | 0.038 | 0.250 |
| article write | 00:00:00.305 | 0.0% | 95 | 0.000 | 3.211 | 24.778 |
| data move | 00:00:00.013 | 0.0% | 125 | 0.000 | 0.104 | 0.462 |
| history grep | 00:00:00.000 | 0.0% | 0 | 0.000 | 0.000 | 0.000 |
| history lookup | 00:00:00.075 | 0.0% | 190 | 0.000 | 0.395 | 3.111 |
| history sync | 00:00:00.043 | 0.0% | 309 | 0.000 | 0.139 | 6.333 |
| history write | 00:00:00.050 | 0.0% | 95 | 0.000 | 0.526 | 5.000 |
| idle | 24:00:40.461 | 100.0% | 3636 | 10005.567 | 23773.504 | 33350.167 |
| nntp read | 00:00:00.012 | 0.0% | 1733 | 0.000 | 0.007 | 0.150 |
| overview write | 00:00:00.543 | 0.0% | 95 | 0.000 | 5.716 | 49.000 |
| perl filter | 00:00:00.007 | 0.0% | 95 | 0.000 | 0.074 | 0.778 |
| python filter | 00:00:00.198 | 0.0% | 190 | 0.000 | 1.042 | 9.500 |
| site send | 00:00:00.000 | 0.0% | 0 | 0.000 | 0.000 | 0.000 |
| TOTAL: 24:00:42.661 | 24:00:41.732 | 100.0% | - | - | - | - |
nnrpd timer:
| Code region | Time | Pct | Invoked | Min(ms) | Avg(ms) | Max(ms) |
|---|---|---|---|---|---|---|
| idle | 00:01:23.985 | 95.4% | 7 | 126.000 | 11997.857 | 39790.500 |
| newnews | 00:00:00.000 | 0.0% | 0 | 0.000 | 0.000 | 0.000 |
| nntpwrite | 00:00:00.000 | 0.0% | 18 | 0.000 | 0.000 | 0.000 |
| TOTAL: 00:01:28.050 | 00:01:23.985 | 95.4% | - | - | - | - |
Control commands to INND:
| Command | Number |
|---|---|
| flush | 144 |
| flushlogs | 2 |
| go | 2 |
| logmode | 2 |
| lowmark | 1 |
| mode | 149 |
| name | 2 |
| pause | 2 |
| paused | 2 |
| reload | 2 |
| reserve | 2 |
| TOTAL: 11 | 310 |
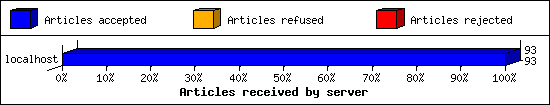
Incoming Feeds (INN):
| Server | Connects | Offered | Taken | Refused | Reject | %Accpt | Elapsed | |
|---|---|---|---|---|---|---|---|---|
| 1 | localhost | 1520 | 93 | 93 | 0 | 0 | 100% | 00:00:02 |
| TOTAL: 1 | 1520 | 93 | 93 | 0 | 0 | 100% | 00:00:02 | |
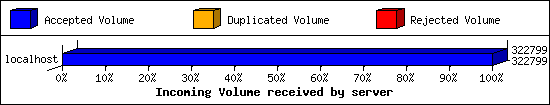
Incoming Volume (INN):
| Server | AcceptVol | DupVol | RejVol | TotalVol | %Acc | Vol/Art | |
|---|---|---|---|---|---|---|---|
| 1 | localhost | 315.2 KB | 0.0 KB | 0.0 KB | 315.2 KB | 100% | 3.4 KB |
| TOTAL: 1 | 315.2 KB | 0.0 KB | 0.0 KB | 315.2 KB | 100% | 3.4 KB | |
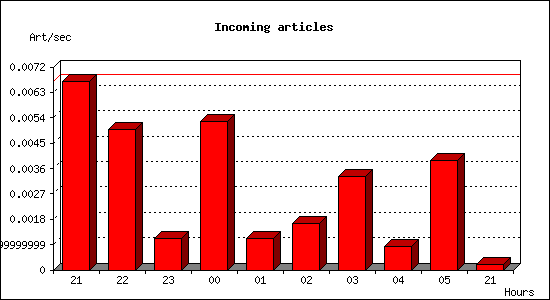
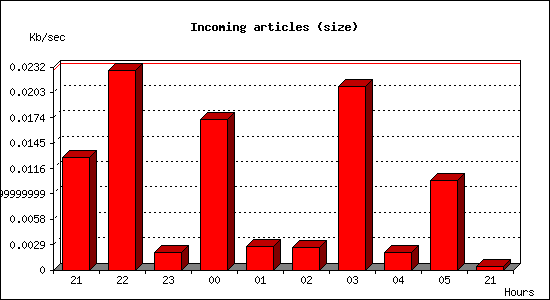
Incoming articles:
| Date | Articles | %Arts | Art/sec | Size | %Size | KB/sec |
|---|---|---|---|---|---|---|
| Jan 22 21:30:02 - 21:59:59 | 12 | 12.9% | 0.01 | 23.1 KB | 7.3% | 0.01 |
| Jan 22 22:00:00 - 22:59:59 | 18 | 19.4% | 0.01 | 82.3 KB | 26.1% | 0.02 |
| Jan 22 23:00:00 - 23:59:59 | 4 | 4.3% | 0.00 | 7.1 KB | 2.3% | 0.00 |
| Jan 23 00:00:00 - 00:59:59 | 19 | 20.4% | 0.01 | 61.9 KB | 19.6% | 0.02 |
| Jan 23 01:00:00 - 01:59:59 | 4 | 4.3% | 0.00 | 9.8 KB | 3.1% | 0.00 |
| Jan 23 02:00:00 - 02:59:59 | 6 | 6.5% | 0.00 | 9.2 KB | 2.9% | 0.00 |
| Jan 23 03:00:00 - 03:59:59 | 12 | 12.9% | 0.00 | 75.3 KB | 23.9% | 0.02 |
| Jan 23 04:00:00 - 04:59:59 | 3 | 3.2% | 0.00 | 7.3 KB | 2.3% | 0.00 |
| Jan 23 05:00:00 - 05:59:59 | 14 | 15.1% | 0.00 | 37.0 KB | 11.7% | 0.01 |
| Jan 23 06:00:00 - 21:30:02 | 1 | 1.1% | 0.00 | 2.4 KB | 0.7% | 0.00 |
| TOTAL: 10:00:00 | 93 | 100.0% | 0.00 | 315.2 KB | 100.0% | 0.01 |
NNRP readership statistics:
| System | Conn | Arts | Size | Groups | Post | Rej | Elapsed | |
|---|---|---|---|---|---|---|---|---|
| 1 | 104.152.52.58 | 1 | 0 | 0.0 KB | 0 | 0 | 0 | 00:00:00 |
| 2 | 104.152.52.56 | 1 | 0 | 0.0 KB | 0 | 0 | 0 | 00:00:00 |
| 3 | 104.152.52.59 | 1 | 0 | 0.0 KB | 0 | 0 | 0 | 00:00:00 |
| 4 | 60.190.226.187 | 1 | 0 | 0.0 KB | 0 | 0 | 0 | 00:01:22 |
| 5 | awesome.monitoring.internet-measurement.com | 1 | 0 | 0.0 KB | 0 | 0 | 0 | 00:00:02 |
| 6 | pleasurable.monitoring.internet-measurement.com | 1 | 0 | 0.0 KB | 0 | 0 | 0 | 00:00:01 |
| TOTAL: 6 | 6 | 0 | 0.0 KB | 0 | 0 | 0 | 00:01:28 | |
NNRP readership statistics (by domain):
| System | Conn | Arts | Size | Groups | Post | Rej | Elapsed | |
|---|---|---|---|---|---|---|---|---|
| 1 | *.monitoring.internet-measurement.com | 2 | 0 | 0.0 KB | 0 | 0 | 0 | 00:00:04 |
| 2 | unresolved | 4 | 0 | 0.0 KB | 0 | 0 | 0 | 00:01:23 |
| TOTAL: 2 | 6 | 0 | 0.0 KB | 0 | 0 | 0 | 00:01:28 | |
NNRP total resource statistics [Top 20]:
| System | User(ms) | System(ms) | Idle(ms) | Elapsed |
|---|---|---|---|---|
| 60.190.226.187 | 0.006 | 0.006 | 0.000 | 00:01:22 |
| awesome.monitoring.internet-measurement.com | 0.006 | 0.005 | 0.000 | 00:00:02 |
| pleasurable.monitoring.internet-measurement.com | 0.006 | 0.008 | 0.000 | 00:00:01 |
| 104.152.52.58 | 0.004 | 0.005 | 0.000 | 00:00:00 |
| 104.152.52.56 | 0.007 | 0.004 | 0.000 | 00:00:00 |
| 104.152.52.59 | 0.004 | 0.005 | 0.000 | 00:00:00 |
| ? | 0.018 | 0.011 | 0.000 | 00:00:00 |
| TOTAL: 7 | 0.051 | 0.044 | 0.000 | 00:01:28 |
NNRP gethostbyaddr failures [Top 20]:
| System | Conn |
|---|---|
| ? (can't getpeername) | 3 |
| TOTAL: 1 | 3 |
NNRP unrecognized commands (by host):
| System | Conn |
|---|---|
| 60.190.226.187 | 1 |
| TOTAL: 1 | 1 |
NNRP unrecognized commands (by command):
| Command | Count |
|---|---|
| GET / HTTP/1.0 | 1 |
| TOTAL: 1 | 1 |
NNRP client timeouts [Top 20]:
| System | Conn | Peer |
|---|---|---|
| 60.190.226.187 | 2 | 0 |
| TOTAL: 1 | 2 | 0 |