Unknown entries from news log file:
First 4 / 4 lines (100.0%)
Log entries by program:
| Program name | Lines | %Lines | Size | %Size |
|---|---|---|---|---|
| innd | 6097 | 94.6% | 741.6 KB | 94.8% |
| inn | 282 | 4.4% | 33.6 KB | 4.3% |
| nnrpd | 64 | 1.0% | 7.4 KB | 0.9% |
| TOTAL: 3 | 6443 | 100.0% | 782.7 KB | 100.0% |
History cache:
| Reason | Count | %Count |
|---|---|---|
| Do not exist | 282 | 50.0% |
| Negative hits | 282 | 50.0% |
| Cache misses | 0 | 0.0% |
| Positive hits | 0 | 0.0% |
| TOTAL: 4 | 564 | 100.0% |
INND timer:
| Code region | Time | Pct | Invoked | Min(ms) | Avg(ms) | Max(ms) |
|---|---|---|---|---|---|---|
| article cancel | 00:00:00.000 | 0.0% | 0 | 0.000 | 0.000 | 0.000 |
| article cleanup | 00:00:00.001 | 0.0% | 282 | 0.000 | 0.004 | 0.500 |
| article logging | 00:00:00.003 | 0.0% | 282 | 0.000 | 0.011 | 0.143 |
| article parse | 00:00:00.005 | 0.0% | 574 | 0.000 | 0.009 | 0.167 |
| article write | 00:00:00.243 | 0.0% | 282 | 0.000 | 0.862 | 34.000 |
| data move | 00:00:00.003 | 0.0% | 296 | 0.000 | 0.010 | 0.250 |
| history grep | 00:00:00.000 | 0.0% | 0 | 0.000 | 0.000 | 0.000 |
| history lookup | 00:00:00.093 | 0.0% | 564 | 0.000 | 0.165 | 7.500 |
| history sync | 00:00:00.025 | 0.0% | 326 | 0.000 | 0.077 | 2.000 |
| history write | 00:00:00.049 | 0.0% | 282 | 0.000 | 0.174 | 4.000 |
| idle | 24:00:46.216 | 100.0% | 4259 | 11767.216 | 20297.304 | 27286.227 |
| nntp read | 00:00:00.009 | 0.0% | 2212 | 0.000 | 0.004 | 0.100 |
| overview write | 00:00:00.115 | 0.0% | 282 | 0.000 | 0.408 | 22.000 |
| perl filter | 00:00:00.000 | 0.0% | 282 | 0.000 | 0.000 | 0.000 |
| python filter | 00:00:00.051 | 0.0% | 564 | 0.000 | 0.090 | 15.000 |
| site send | 00:00:00.000 | 0.0% | 0 | 0.000 | 0.000 | 0.000 |
| TOTAL: 24:00:47.895 | 24:00:46.813 | 100.0% | - | - | - | - |
nnrpd timer:
| Code region | Time | Pct | Invoked | Min(ms) | Avg(ms) | Max(ms) |
|---|---|---|---|---|---|---|
| idle | 00:00:27.920 | 96.1% | 23 | 18.000 | 1213.913 | 12490.500 |
| newnews | 00:00:00.000 | 0.0% | 0 | 0.000 | 0.000 | 0.000 |
| nntpwrite | 00:00:00.000 | 0.0% | 78 | 0.000 | 0.000 | 0.000 |
| TOTAL: 00:00:29.062 | 00:00:27.920 | 96.1% | - | - | - | - |
Control commands to INND:
| Command | Number |
|---|---|
| flush | 144 |
| flushlogs | 2 |
| go | 2 |
| logmode | 3 |
| lowmark | 1 |
| mode | 150 |
| name | 3 |
| pause | 2 |
| paused | 2 |
| reload | 2 |
| reserve | 2 |
| TOTAL: 11 | 313 |
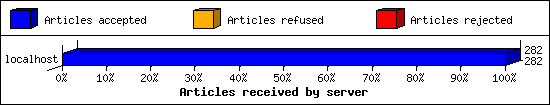
Incoming Feeds (INN):
| Server | Connects | Offered | Taken | Refused | Reject | %Accpt | Elapsed | |
|---|---|---|---|---|---|---|---|---|
| 1 | localhost | 1637 | 282 | 282 | 0 | 0 | 100% | 00:00:00 |
| TOTAL: 1 | 1637 | 282 | 282 | 0 | 0 | 100% | 00:00:00 | |
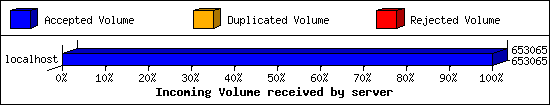
Incoming Volume (INN):
| Server | AcceptVol | DupVol | RejVol | TotalVol | %Acc | Vol/Art | |
|---|---|---|---|---|---|---|---|
| 1 | localhost | 637.8 KB | 0.0 KB | 0.0 KB | 637.8 KB | 100% | 2.3 KB |
| TOTAL: 1 | 637.8 KB | 0.0 KB | 0.0 KB | 637.8 KB | 100% | 2.3 KB | |
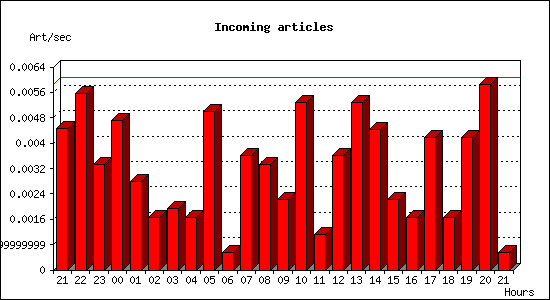
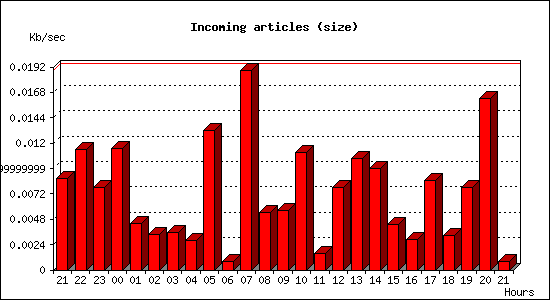
Incoming articles:
| Date | Articles | %Arts | Art/sec | Size | %Size | KB/sec |
|---|---|---|---|---|---|---|
| Feb 2 21:30:02 - 21:59:59 | 8 | 2.8% | 0.00 | 15.5 KB | 2.4% | 0.01 |
| Feb 2 22:00:00 - 22:59:59 | 20 | 7.1% | 0.01 | 41.0 KB | 6.4% | 0.01 |
| Feb 2 23:00:00 - 23:59:59 | 12 | 4.3% | 0.00 | 28.1 KB | 4.4% | 0.01 |
| Feb 3 00:00:00 - 00:59:59 | 17 | 6.0% | 0.00 | 41.3 KB | 6.5% | 0.01 |
| Feb 3 01:00:00 - 01:59:59 | 10 | 3.5% | 0.00 | 15.8 KB | 2.5% | 0.00 |
| Feb 3 02:00:00 - 02:59:59 | 6 | 2.1% | 0.00 | 12.1 KB | 1.9% | 0.00 |
| Feb 3 03:00:00 - 03:59:59 | 7 | 2.5% | 0.00 | 12.9 KB | 2.0% | 0.00 |
| Feb 3 04:00:00 - 04:59:59 | 6 | 2.1% | 0.00 | 10.1 KB | 1.6% | 0.00 |
| Feb 3 05:00:00 - 05:59:59 | 18 | 6.4% | 0.01 | 47.6 KB | 7.5% | 0.01 |
| Feb 3 06:00:00 - 06:59:59 | 2 | 0.7% | 0.00 | 2.9 KB | 0.4% | 0.00 |
| Feb 3 07:00:00 - 07:59:59 | 13 | 4.6% | 0.00 | 68.1 KB | 10.7% | 0.02 |
| Feb 3 08:00:00 - 08:59:59 | 12 | 4.3% | 0.00 | 19.6 KB | 3.1% | 0.01 |
| Feb 3 09:00:00 - 09:59:59 | 8 | 2.8% | 0.00 | 20.1 KB | 3.2% | 0.01 |
| Feb 3 10:00:00 - 10:59:59 | 19 | 6.7% | 0.01 | 40.1 KB | 6.3% | 0.01 |
| Feb 3 11:00:00 - 11:59:59 | 4 | 1.4% | 0.00 | 5.7 KB | 0.9% | 0.00 |
| Feb 3 12:00:00 - 12:59:59 | 13 | 4.6% | 0.00 | 28.0 KB | 4.4% | 0.01 |
| Feb 3 13:00:00 - 13:59:59 | 19 | 6.7% | 0.01 | 37.9 KB | 5.9% | 0.01 |
| Feb 3 14:00:00 - 14:59:59 | 16 | 5.7% | 0.00 | 34.5 KB | 5.4% | 0.01 |
| Feb 3 15:00:00 - 15:59:59 | 8 | 2.8% | 0.00 | 15.5 KB | 2.4% | 0.00 |
| Feb 3 16:00:00 - 16:59:59 | 6 | 2.1% | 0.00 | 10.5 KB | 1.6% | 0.00 |
| Feb 3 17:00:00 - 17:59:59 | 15 | 5.3% | 0.00 | 30.6 KB | 4.8% | 0.01 |
| Feb 3 18:00:00 - 18:59:59 | 6 | 2.1% | 0.00 | 11.9 KB | 1.9% | 0.00 |
| Feb 3 19:00:00 - 19:59:59 | 15 | 5.3% | 0.00 | 28.1 KB | 4.4% | 0.01 |
| Feb 3 20:00:00 - 20:59:59 | 21 | 7.4% | 0.01 | 58.4 KB | 9.2% | 0.02 |
| Feb 3 21:00:00 - 21:30:02 | 1 | 0.4% | 0.00 | 1.4 KB | 0.2% | 0.00 |
| TOTAL: 24:00:00 | 282 | 100.0% | 0.00 | 637.8 KB | 100.0% | 0.01 |
NNRP readership statistics:
| System | Conn | Arts | Size | Groups | Post | Rej | Elapsed | |
|---|---|---|---|---|---|---|---|---|
| 1 | scan-10.skipa.cyberok.ru | 1 | 0 | 0.0 KB | 0 | 0 | 0 | 00:00:00 |
| 2 | 143-42-63-237.ip.linodeusercontent.com | 8 | 0 | 0.0 KB | 0 | 0 | 0 | 00:00:02 |
| 3 | 104.152.52.71 | 1 | 0 | 0.0 KB | 0 | 0 | 0 | 00:00:00 |
| 4 | 222.186.13.131 | 1 | 0 | 0.0 KB | 0 | 0 | 0 | 00:00:24 |
| 5 | 71.6.134.230 | 2 | 0 | 0.0 KB | 0 | 0 | 0 | 00:00:01 |
| 6 | 204.93.154.215 | 1 | 0 | 0.0 KB | 0 | 0 | 0 | 00:00:00 |
| TOTAL: 6 | 14 | 0 | 0.0 KB | 0 | 0 | 0 | 00:00:29 | |
NNRP readership statistics (by domain):
| System | Conn | Arts | Size | Groups | Post | Rej | Elapsed | |
|---|---|---|---|---|---|---|---|---|
| 1 | *.skipa.cyberok.ru | 1 | 0 | 0.0 KB | 0 | 0 | 0 | 00:00:00 |
| 2 | unresolved | 5 | 0 | 0.0 KB | 0 | 0 | 0 | 00:00:26 |
| 3 | *.ip.linodeusercontent.com | 8 | 0 | 0.0 KB | 0 | 0 | 0 | 00:00:02 |
| TOTAL: 3 | 14 | 0 | 0.0 KB | 0 | 0 | 0 | 00:00:29 | |
NNRP total resource statistics [Top 20]:
| System | User(ms) | System(ms) | Idle(ms) | Elapsed |
|---|---|---|---|---|
| 222.186.13.131 | 0.007 | 0.005 | 0.000 | 00:00:24 |
| 143-42-63-237.ip.linodeusercontent.com | 0.070 | 0.052 | 0.000 | 00:00:02 |
| 71.6.134.230 | 0.017 | 0.009 | 0.000 | 00:00:01 |
| 204.93.154.215 | 0.008 | 0.005 | 0.000 | 00:00:00 |
| 104.152.52.71 | 0.007 | 0.003 | 0.000 | 00:00:00 |
| scan-10.skipa.cyberok.ru | 0.005 | 0.006 | 0.000 | 00:00:00 |
| ? | 0.012 | 0.008 | 0.000 | 00:00:00 |
| TOTAL: 7 | 0.126 | 0.088 | 0.000 | 00:00:29 |
NNRP gethostbyaddr failures [Top 20]:
| System | Conn |
|---|---|
| ? (can't getpeername) | 2 |
| TOTAL: 1 | 2 |
NNRP unrecognized commands (by host):
| System | Conn |
|---|---|
| 143-42-63-237.ip.linodeusercontent.com | 3 |
| TOTAL: 1 | 3 |
NNRP unrecognized commands (by command):
| Command | Count |
|---|---|
| #026#003#001#002 | 1 |
| À#024 | 1 |
| #026#003#001 | 1 |
| TOTAL: 3 | 3 |
NNRP client timeouts [Top 20]:
| System | Conn | Peer |
|---|---|---|
| 143-42-63-237.ip.linodeusercontent.com | 1 | 1 |
| TOTAL: 1 | 1 | 2 |