Unknown entries from news log file:
First 4 / 4 lines (100.0%)
Log entries by program:
| Program name | Lines | %Lines | Size | %Size |
|---|---|---|---|---|
| innd | 6012 | 85.6% | 730.9 KB | 87.3% |
| nnrpd | 793 | 11.3% | 80.3 KB | 9.6% |
| inn | 220 | 3.1% | 26.4 KB | 3.2% |
| TOTAL: 3 | 7025 | 100.0% | 837.6 KB | 100.0% |
History cache:
| Reason | Count | %Count |
|---|---|---|
| Do not exist | 219 | 50.0% |
| Negative hits | 219 | 50.0% |
| Cache misses | 0 | 0.0% |
| Positive hits | 0 | 0.0% |
| TOTAL: 4 | 438 | 100.0% |
INND timer:
| Code region | Time | Pct | Invoked | Min(ms) | Avg(ms) | Max(ms) |
|---|---|---|---|---|---|---|
| article cancel | 00:00:00.000 | 0.0% | 0 | 0.000 | 0.000 | 0.000 |
| article cleanup | 00:00:00.003 | 0.0% | 219 | 0.000 | 0.014 | 0.333 |
| article logging | 00:00:00.009 | 0.0% | 219 | 0.000 | 0.041 | 1.000 |
| article parse | 00:00:00.003 | 0.0% | 442 | 0.000 | 0.007 | 0.333 |
| article write | 00:00:00.158 | 0.0% | 219 | 0.000 | 0.721 | 2.000 |
| data move | 00:00:00.001 | 0.0% | 224 | 0.000 | 0.004 | 0.200 |
| history grep | 00:00:00.000 | 0.0% | 0 | 0.000 | 0.000 | 0.000 |
| history lookup | 00:00:00.044 | 0.0% | 438 | 0.000 | 0.100 | 0.500 |
| history sync | 00:00:00.052 | 0.0% | 301 | 0.000 | 0.173 | 4.500 |
| history write | 00:00:00.047 | 0.0% | 219 | 0.000 | 0.215 | 1.667 |
| idle | 24:00:43.848 | 100.0% | 4081 | 7066.212 | 21182.026 | 27289.636 |
| nntp read | 00:00:00.009 | 0.0% | 2054 | 0.000 | 0.004 | 0.100 |
| overview write | 00:00:00.098 | 0.0% | 219 | 0.000 | 0.447 | 4.000 |
| perl filter | 00:00:00.000 | 0.0% | 219 | 0.000 | 0.000 | 0.000 |
| python filter | 00:00:00.026 | 0.0% | 438 | 0.000 | 0.059 | 0.500 |
| site send | 00:00:00.000 | 0.0% | 0 | 0.000 | 0.000 | 0.000 |
| TOTAL: 24:00:45.009 | 24:00:44.298 | 100.0% | - | - | - | - |
nnrpd timer:
| Code region | Time | Pct | Invoked | Min(ms) | Avg(ms) | Max(ms) |
|---|---|---|---|---|---|---|
| idle | 02:16:33.563 | 99.7% | 891 | 0.000 | 9195.918 | 37538.688 |
| newnews | 00:00:00.000 | 0.0% | 0 | 0.000 | 0.000 | 0.000 |
| nntpwrite | 00:00:00.431 | 0.0% | 3569 | 0.000 | 0.121 | 0.987 |
| readart | 00:00:00.048 | 0.0% | 104 | 0.000 | 0.462 | 1.000 |
| TOTAL: 02:16:58.531 | 02:16:34.042 | 99.7% | - | - | - | - |
Control commands to INND:
| Command | Number |
|---|---|
| flush | 143 |
| flushlogs | 2 |
| go | 2 |
| logmode | 2 |
| lowmark | 1 |
| mode | 148 |
| name | 1 |
| pause | 2 |
| paused | 2 |
| reload | 2 |
| reserve | 2 |
| TOTAL: 11 | 307 |
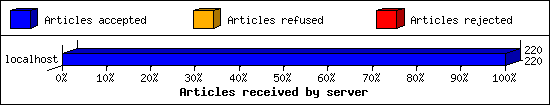
Incoming Feeds (INN):
| Server | Connects | Offered | Taken | Refused | Reject | %Accpt | Elapsed | |
|---|---|---|---|---|---|---|---|---|
| 1 | localhost | 1612 | 220 | 220 | 0 | 0 | 100% | 00:00:02 |
| TOTAL: 1 | 1612 | 220 | 220 | 0 | 0 | 100% | 00:00:02 | |
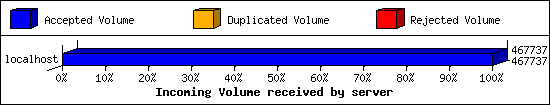
Incoming Volume (INN):
| Server | AcceptVol | DupVol | RejVol | TotalVol | %Acc | Vol/Art | |
|---|---|---|---|---|---|---|---|
| 1 | localhost | 456.8 KB | 0.0 KB | 0.0 KB | 456.8 KB | 100% | 2.1 KB |
| TOTAL: 1 | 456.8 KB | 0.0 KB | 0.0 KB | 456.8 KB | 100% | 2.1 KB | |
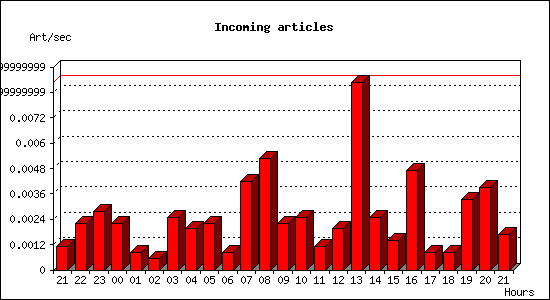
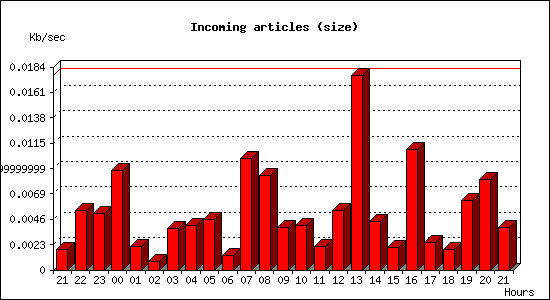
Incoming articles:
| Date | Articles | %Arts | Art/sec | Size | %Size | KB/sec |
|---|---|---|---|---|---|---|
| Feb 6 21:30:02 - 21:59:59 | 2 | 0.9% | 0.00 | 3.3 KB | 0.7% | 0.00 |
| Feb 6 22:00:00 - 22:59:59 | 8 | 3.6% | 0.00 | 19.4 KB | 4.2% | 0.01 |
| Feb 6 23:00:00 - 23:59:59 | 10 | 4.5% | 0.00 | 18.4 KB | 4.0% | 0.01 |
| Feb 7 00:00:00 - 00:59:59 | 8 | 3.6% | 0.00 | 32.5 KB | 7.1% | 0.01 |
| Feb 7 01:00:00 - 01:59:59 | 3 | 1.4% | 0.00 | 7.5 KB | 1.7% | 0.00 |
| Feb 7 02:00:00 - 02:59:59 | 2 | 0.9% | 0.00 | 2.7 KB | 0.6% | 0.00 |
| Feb 7 03:00:00 - 03:59:59 | 9 | 4.1% | 0.00 | 13.7 KB | 3.0% | 0.00 |
| Feb 7 04:00:00 - 04:59:59 | 7 | 3.2% | 0.00 | 14.4 KB | 3.2% | 0.00 |
| Feb 7 05:00:00 - 05:59:59 | 8 | 3.6% | 0.00 | 16.4 KB | 3.6% | 0.00 |
| Feb 7 06:00:00 - 06:59:59 | 3 | 1.4% | 0.00 | 4.8 KB | 1.1% | 0.00 |
| Feb 7 07:00:00 - 07:59:59 | 15 | 6.8% | 0.00 | 36.5 KB | 8.0% | 0.01 |
| Feb 7 08:00:00 - 08:59:59 | 19 | 8.6% | 0.01 | 30.9 KB | 6.8% | 0.01 |
| Feb 7 09:00:00 - 09:59:59 | 8 | 3.6% | 0.00 | 13.7 KB | 3.0% | 0.00 |
| Feb 7 10:00:00 - 10:59:59 | 9 | 4.1% | 0.00 | 14.6 KB | 3.2% | 0.00 |
| Feb 7 11:00:00 - 11:59:59 | 4 | 1.8% | 0.00 | 7.5 KB | 1.6% | 0.00 |
| Feb 7 12:00:00 - 12:59:59 | 7 | 3.2% | 0.00 | 19.4 KB | 4.2% | 0.01 |
| Feb 7 13:00:00 - 13:59:59 | 32 | 14.5% | 0.01 | 63.5 KB | 13.9% | 0.02 |
| Feb 7 14:00:00 - 14:59:59 | 9 | 4.1% | 0.00 | 15.9 KB | 3.5% | 0.00 |
| Feb 7 15:00:00 - 15:59:59 | 5 | 2.3% | 0.00 | 7.3 KB | 1.6% | 0.00 |
| Feb 7 16:00:00 - 16:59:59 | 17 | 7.7% | 0.00 | 39.4 KB | 8.6% | 0.01 |
| Feb 7 17:00:00 - 17:59:59 | 3 | 1.4% | 0.00 | 9.0 KB | 2.0% | 0.00 |
| Feb 7 18:00:00 - 18:59:59 | 3 | 1.4% | 0.00 | 6.8 KB | 1.5% | 0.00 |
| Feb 7 19:00:00 - 19:59:59 | 12 | 5.5% | 0.00 | 22.7 KB | 5.0% | 0.01 |
| Feb 7 20:00:00 - 20:59:59 | 14 | 6.4% | 0.00 | 29.6 KB | 6.5% | 0.01 |
| Feb 7 21:00:00 - 21:29:53 | 3 | 1.4% | 0.00 | 6.9 KB | 1.5% | 0.00 |
| TOTAL: 23:59:51 | 220 | 100.0% | 0.00 | 456.8 KB | 100.0% | 0.01 |
NNRP readership statistics:
| System | Conn | Arts | Size | Groups | Post | Rej | Elapsed | |
|---|---|---|---|---|---|---|---|---|
| 1 | 2a02:e840::7918:47d8:d46a:4be0 | 9 | 55 | 106.2 KB | 9 | 0 | 0 | 02:01:40 |
| 2 | 46.163.139.168 | 4 | 35 | 41.4 KB | 3 | 0 | 0 | 00:14:41 |
| TOTAL: 2 | 13 | 90 | 147.5 KB | 12 | 0 | 0 | 02:16:58 | |
NNRP readership statistics (by domain):
| System | Conn | Arts | Size | Groups | Post | Rej | Elapsed | |
|---|---|---|---|---|---|---|---|---|
| 1 | ? | 9 | 55 | 106.2 KB | 9 | 0 | 0 | 02:01:40 |
| 2 | unresolved | 7 | 35 | 41.4 KB | 3 | 0 | 0 | 00:15:06 |
| 3 | *.monitoring.internet-measurement.com | 2 | 0 | 0.0 KB | 0 | 0 | 0 | 00:00:04 |
| 4 | *.static.ip.netia.com.pl | 6 | 0 | 0.0 KB | 0 | 0 | 0 | 00:00:01 |
| 5 | *.census.shodan.io | 1 | 0 | 0.0 KB | 0 | 0 | 0 | 00:00:03 |
| 6 | *.ip.linodeusercontent.com | 8 | 0 | 0.0 KB | 0 | 0 | 0 | 00:00:02 |
| TOTAL: 6 | 33 | 90 | 147.5 KB | 12 | 0 | 0 | 02:16:58 | |
NNRP auth users [Top 20]:
| User | Conn |
|---|---|
| denis | 9 |
| TOTAL: 1 | 9 |
NNRP total resource statistics [Top 20]:
| System | User(ms) | System(ms) | Idle(ms) | Elapsed |
|---|---|---|---|---|
| 2a02:e840::7918:47d8:d46a:4be0 | 0.116 | 0.157 | 0.109 | 02:01:40 |
| 46.163.139.168 | 0.039 | 0.052 | 0.000 | 00:14:41 |
| 8.219.84.3 | 0.012 | 0.010 | 0.000 | 00:00:23 |
| refrigerator.census.shodan.io | 0.004 | 0.007 | 0.000 | 00:00:03 |
| upbeat.monitoring.internet-measurement.com | 0.004 | 0.006 | 0.000 | 00:00:02 |
| 143-42-63-237.ip.linodeusercontent.com | 0.067 | 0.040 | 0.000 | 00:00:02 |
| successful.monitoring.internet-measurement.com | 0.005 | 0.007 | 0.000 | 00:00:01 |
| 78-11-84-52.static.ip.netia.com.pl | 0.039 | 0.026 | 0.000 | 00:00:01 |
| 162.243.135.16 | 0.006 | 0.005 | 0.000 | 00:00:00 |
| TOTAL: 9 | 0.292 | 0.310 | 0.109 | 02:16:58 |
Curious NNRP server explorers [Top 20]:
| System | Conn |
|---|---|
| 143-42-63-237.ip.linodeusercontent.com | 8 |
| 78-11-84-52.static.ip.netia.com.pl | 6 |
| 8.219.84.3 | 2 |
| upbeat.monitoring.internet-measurement.com | 1 |
| refrigerator.census.shodan.io | 1 |
| successful.monitoring.internet-measurement.com | 1 |
| 162.243.135.16 | 1 |
| TOTAL: 7 | 20 |
NNRP unrecognized commands (by host):
| System | Conn |
|---|---|
| 78-11-84-52.static.ip.netia.com.pl | 30 |
| 143-42-63-237.ip.linodeusercontent.com | 4 |
| 162.243.135.16 | 1 |
| TOTAL: 3 | 35 |
NNRP unrecognized commands (by command):
| Command | Count |
|---|---|
| Accept: */* | 5 |
| Connection: close | 5 |
| User-Agent: Mozilla/5.0 (Macintosh; U; I... | 5 |
| Accept-Encoding: gzip, deflate | 5 |
| Host: 37.46.134.137:119 | 5 |
| #026#003#001#002 | 1 |
| ºÏ@#011½°ªv÷4x5ÁËÙ#010¡$#0374I Y#025#010!Pw»s¹ã7ÞÁF[9à... | 1 |
| GET /favicon.ico HTTP/1.1 | 1 |
| À#024 | 1 |
| MGLNDD_37.46.134.137_119 | 1 |
| GET / HTTP/1.1 | 1 |
| #026#003#001 | 1 |
| GET /image/lgbg.jpg HTTP/1.1 | 1 |
| GET /skin/default_1/images/logo.png HTTP... | 1 |
| GET /login.rsp HTTP/1.1 | 1 |
| TOTAL: 15 | 35 |
NNRP client timeouts [Top 20]:
| System | Conn | Peer |
|---|---|---|
| 2a02:e840::7918:47d8:d46a:4be0 | 5 | 0 |
| 143-42-63-237.ip.linodeusercontent.com | 1 | 1 |
| TOTAL: 2 | 6 | 1 |
Newsgroup request counts (by category):
| Category | Count | Pct | |
|---|---|---|---|
| 1 | fido7 | 90 | 100.0% |
| TOTAL: 1 | 90 | 100.0% | |
Newsgroup request counts (by newsgroup) [Top 100]:
| Newsgroup | Count | |
|---|---|---|
| 1 | fido7.concord | 41 |
| 2 | fido7.su.books | 35 |
| 3 | fido7.n5053.exchange | 6 |
| 4 | fido7.n5053.common | 5 |
| 5 | fido7.ru.unix | 2 |
| 6 | fido7.ipv6 | 1 |
| TOTAL: 6 | 90 | |