Log entries by program:
| Program name | Lines | %Lines | Size | %Size |
|---|---|---|---|---|
| innd | 6090 | 94.5% | 742.7 KB | 94.6% |
| inn | 256 | 4.0% | 30.7 KB | 3.9% |
| nnrpd | 98 | 1.5% | 11.1 KB | 1.4% |
| batcher | 2 | 0.0% | 0.2 KB | 0.0% |
| TOTAL: 4 | 6446 | 100.0% | 784.7 KB | 100.0% |
History cache:
| Reason | Count | %Count |
|---|---|---|
| Negative hits | 256 | 50.0% |
| Do not exist | 256 | 50.0% |
| Cache misses | 0 | 0.0% |
| Positive hits | 0 | 0.0% |
| TOTAL: 4 | 512 | 100.0% |
INND timer:
| Code region | Time | Pct | Invoked | Min(ms) | Avg(ms) | Max(ms) |
|---|---|---|---|---|---|---|
| article cancel | 00:00:00.000 | 0.0% | 0 | 0.000 | 0.000 | 0.000 |
| article cleanup | 00:00:00.001 | 0.0% | 256 | 0.000 | 0.004 | 1.000 |
| article logging | 00:00:00.011 | 0.0% | 256 | 0.000 | 0.043 | 1.000 |
| article parse | 00:00:00.007 | 0.0% | 521 | 0.000 | 0.013 | 0.250 |
| article write | 00:00:00.167 | 0.0% | 256 | 0.000 | 0.652 | 4.333 |
| data move | 00:00:00.004 | 0.0% | 269 | 0.000 | 0.015 | 0.667 |
| history grep | 00:00:00.000 | 0.0% | 0 | 0.000 | 0.000 | 0.000 |
| history lookup | 00:00:00.083 | 0.0% | 512 | 0.000 | 0.162 | 3.000 |
| history sync | 00:00:00.032 | 0.0% | 296 | 0.000 | 0.108 | 13.000 |
| history write | 00:00:00.058 | 0.0% | 256 | 0.000 | 0.227 | 4.000 |
| idle | 24:00:38.954 | 100.0% | 4169 | 7898.026 | 20733.738 | 27288.091 |
| nntp read | 00:00:00.013 | 0.0% | 2158 | 0.000 | 0.006 | 0.100 |
| overview write | 00:00:00.071 | 0.0% | 256 | 0.000 | 0.277 | 2.000 |
| perl filter | 00:00:00.000 | 0.0% | 256 | 0.000 | 0.000 | 0.000 |
| python filter | 00:00:00.033 | 0.0% | 512 | 0.000 | 0.064 | 4.500 |
| site send | 00:00:00.000 | 0.0% | 1 | 0.000 | 0.000 | 0.000 |
| TOTAL: 24:00:40.135 | 24:00:39.434 | 100.0% | - | - | - | - |
nnrpd timer:
| Code region | Time | Pct | Invoked | Min(ms) | Avg(ms) | Max(ms) |
|---|---|---|---|---|---|---|
| idle | 00:08:30.217 | 99.7% | 98 | 10.000 | 5206.296 | 16942.667 |
| newnews | 00:00:00.000 | 0.0% | 0 | 0.000 | 0.000 | 0.000 |
| nntpwrite | 00:00:00.025 | 0.0% | 908 | 0.000 | 0.028 | 0.500 |
| readart | 00:00:00.003 | 0.0% | 14 | 0.214 | 0.214 | 0.214 |
| TOTAL: 00:08:31.544 | 00:08:30.245 | 99.7% | - | - | - | - |
Control commands to INND:
| Command | Number |
|---|---|
| flush | 144 |
| flushlogs | 2 |
| go | 2 |
| logmode | 2 |
| lowmark | 1 |
| mode | 149 |
| name | 2 |
| pause | 2 |
| paused | 2 |
| reload | 2 |
| reserve | 2 |
| TOTAL: 11 | 310 |
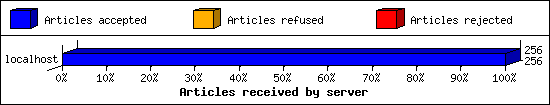
Incoming Feeds (INN):
| Server | Connects | Offered | Taken | Refused | Reject | %Accpt | Elapsed | |
|---|---|---|---|---|---|---|---|---|
| 1 | localhost | 1636 | 256 | 256 | 0 | 0 | 100% | 00:00:03 |
| TOTAL: 1 | 1636 | 256 | 256 | 0 | 0 | 100% | 00:00:03 | |
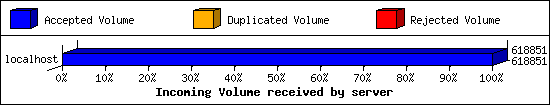
Incoming Volume (INN):
| Server | AcceptVol | DupVol | RejVol | TotalVol | %Acc | Vol/Art | |
|---|---|---|---|---|---|---|---|
| 1 | localhost | 604.3 KB | 0.0 KB | 0.0 KB | 604.3 KB | 100% | 2.4 KB |
| TOTAL: 1 | 604.3 KB | 0.0 KB | 0.0 KB | 604.3 KB | 100% | 2.4 KB | |
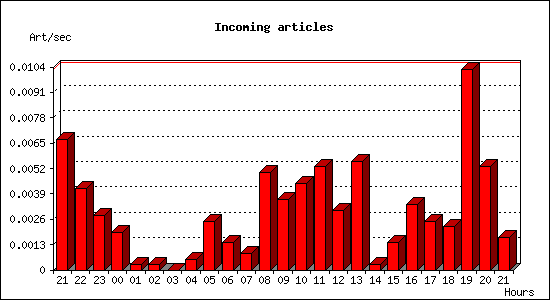
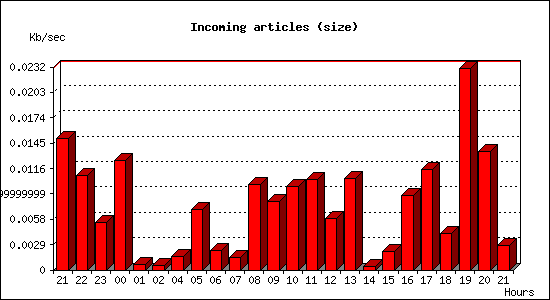
Incoming articles:
| Date | Articles | %Arts | Art/sec | Size | %Size | KB/sec |
|---|---|---|---|---|---|---|
| Apr 16 21:30:02 - 21:59:59 | 12 | 4.7% | 0.01 | 27.1 KB | 0.0% | 0.02 |
| Apr 16 22:00:00 - 22:59:59 | 15 | 5.9% | 0.00 | 38.8 KB | 479.3% | 0.01 |
| Apr 16 23:00:00 - 23:59:59 | 10 | 3.9% | 0.00 | 19.6 KB | 241.7% | 0.01 |
| Apr 17 00:00:00 - 00:59:59 | 7 | 2.7% | 0.00 | 45.0 KB | 555.5% | 0.01 |
| Apr 17 01:00:00 - 01:59:59 | 1 | 0.4% | 0.00 | 2.2 KB | 26.8% | 0.00 |
| Apr 17 02:00:00 - 02:59:59 | 1 | 0.4% | 0.00 | 1.8 KB | 22.8% | 0.00 |
| Apr 17 03:00:00 - 03:59:59 | 0 | 0.0% | 0.00 | 0.0 KB | 0.0% | 0.00 |
| Apr 17 04:00:00 - 04:59:59 | 2 | 0.8% | 0.00 | 5.4 KB | 66.6% | 0.00 |
| Apr 17 05:00:00 - 05:59:59 | 9 | 3.5% | 0.00 | 25.0 KB | 308.2% | 0.01 |
| Apr 17 06:00:00 - 06:59:59 | 5 | 2.0% | 0.00 | 8.1 KB | 100.0% | 0.00 |
| Apr 17 07:00:00 - 07:59:59 | 3 | 1.2% | 0.00 | 5.1 KB | 63.6% | 0.00 |
| Apr 17 08:00:00 - 08:59:59 | 18 | 7.0% | 0.01 | 35.0 KB | 431.9% | 0.01 |
| Apr 17 09:00:00 - 09:59:59 | 13 | 5.1% | 0.00 | 28.0 KB | 345.7% | 0.01 |
| Apr 17 10:00:00 - 10:59:59 | 16 | 6.2% | 0.00 | 34.3 KB | 423.2% | 0.01 |
| Apr 17 11:00:00 - 11:59:59 | 19 | 7.4% | 0.01 | 37.4 KB | 461.4% | 0.01 |
| Apr 17 12:00:00 - 12:59:59 | 11 | 4.3% | 0.00 | 21.0 KB | 259.5% | 0.01 |
| Apr 17 13:00:00 - 13:59:59 | 20 | 7.8% | 0.01 | 37.7 KB | 465.8% | 0.01 |
| Apr 17 14:00:00 - 14:59:59 | 1 | 0.4% | 0.00 | 1.5 KB | 19.0% | 0.00 |
| Apr 17 15:00:00 - 15:59:59 | 5 | 2.0% | 0.00 | 7.7 KB | 95.1% | 0.00 |
| Apr 17 16:00:00 - 16:59:59 | 12 | 4.7% | 0.00 | 30.7 KB | 378.5% | 0.01 |
| Apr 17 17:00:00 - 17:59:59 | 9 | 3.5% | 0.00 | 41.3 KB | 510.2% | 0.01 |
| Apr 17 18:00:00 - 18:59:59 | 8 | 3.1% | 0.00 | 15.0 KB | 185.8% | 0.00 |
| Apr 17 19:00:00 - 19:59:59 | 37 | 14.5% | 0.01 | 82.9 KB | 1023.1% | 0.02 |
| Apr 17 20:00:00 - 20:59:59 | 19 | 7.4% | 0.01 | 48.8 KB | 602.2% | 0.01 |
| Apr 17 21:00:00 - 21:30:02 | 3 | 1.2% | 0.00 | 5.1 KB | 62.5% | 0.00 |
| TOTAL: 24:00:00 | 256 | 100.0% | 0.00 | 8.1 KB | 100.0% | 0.00 |
UUCP batches created:
| Server | Offered | Articles | Size | Elapsed |
|---|---|---|---|---|
| fidogate | 1 | 1 | 1.4 KB | 00:00:00 |
| TOTAL: 1 | 1 | 1 | 1.4 KB | 00:00:00 |
NNRP readership statistics:
| System | Conn | Arts | Size | Groups | Post | Rej | Elapsed | |
|---|---|---|---|---|---|---|---|---|
| 1 | 95-26-114-250.broadband.corbina.ru | 2 | 14 | 22.1 KB | 2 | 1 | 0 | 00:07:13 |
| TOTAL: 1 | 2 | 14 | 22.1 KB | 2 | 1 | 0 | 00:08:31 | |
NNRP readership statistics (by domain):
| System | Conn | Arts | Size | Groups | Post | Rej | Elapsed | |
|---|---|---|---|---|---|---|---|---|
| 1 | *.broadband.corbina.ru | 2 | 14 | 22.1 KB | 2 | 1 | 0 | 00:07:13 |
| 2 | *.monitoring.internet-measurement.com | 2 | 0 | 0.0 KB | 0 | 0 | 0 | 00:00:04 |
| 3 | ? | 1 | 0 | 0.0 KB | 0 | 0 | 0 | 00:00:01 |
| 4 | unresolved | 7 | 0 | 0.0 KB | 0 | 0 | 0 | 00:01:12 |
| TOTAL: 4 | 12 | 14 | 22.1 KB | 2 | 1 | 0 | 00:08:31 | |
NNRP total resource statistics [Top 20]:
| System | User(ms) | System(ms) | Idle(ms) | Elapsed |
|---|---|---|---|---|
| 95-26-114-250.broadband.corbina.ru | 0.030 | 0.043 | 0.000 | 00:07:13 |
| 212.192.158.77 | 0.017 | 0.019 | 0.000 | 00:00:50 |
| 47.237.9.189 | 0.013 | 0.012 | 0.000 | 00:00:21 |
| elated.monitoring.internet-measurement.com | 0.007 | 0.005 | 0.000 | 00:00:02 |
| thrilling.monitoring.internet-measurement.com | 0.006 | 0.005 | 0.000 | 00:00:01 |
| 2a03:d000:14:5bc6:14a2:4dff:fe4d:ff58 | 0.005 | 0.009 | 0.000 | 00:00:01 |
| 81.200.120.106 | 0.006 | 0.010 | 0.000 | 00:00:00 |
| 192.241.231.10 | 0.004 | 0.010 | 0.000 | 00:00:00 |
| TOTAL: 8 | 0.088 | 0.113 | 0.000 | 00:08:31 |
Curious NNRP server explorers [Top 20]:
| System | Conn |
|---|---|
| 212.192.158.77 | 3 |
| 47.237.9.189 | 2 |
| elated.monitoring.internet-measurement.com | 1 |
| 192.241.231.10 | 1 |
| 81.200.120.106 | 1 |
| thrilling.monitoring.internet-measurement.com | 1 |
| 2a03:d000:14:5bc6:14a2:4dff:fe4d:ff58 | 1 |
| TOTAL: 7 | 10 |
NNRP unrecognized commands (by host):
| System | Conn |
|---|---|
| 212.192.158.77 | 3 |
| 192.241.231.10 | 1 |
| TOTAL: 2 | 4 |
NNRP unrecognized commands (by command):
| Command | Count |
|---|---|
| #026#003#001 | 1 |
| \#015\ | 1 |
| #001 | 1 |
| MGLNDD_37.46.134.137_119 | 1 |
| TOTAL: 4 | 4 |
NNRP client timeouts [Top 20]:
| System | Conn | Peer |
|---|---|---|
| 212.192.158.77 | 2 | 1 |
| TOTAL: 1 | 2 | 1 |
Newsgroup request counts (by category):
| Category | Count | Pct | |
|---|---|---|---|
| 1 | fido7 | 14 | 100.0% |
| TOTAL: 1 | 14 | 100.0% | |
Newsgroup request counts (by newsgroup) [Top 100]:
| Newsgroup | Count | |
|---|---|---|
| 1 | fido7.concord | 14 |
| TOTAL: 1 | 14 | |