Unknown entries from news log file:
First 2 / 2 lines (100.0%)
Log entries by program:
| Program name | Lines | %Lines | Size | %Size |
|---|---|---|---|---|
| innd | 6243 | 84.9% | 761.9 KB | 86.4% |
| nnrpd | 741 | 10.1% | 74.9 KB | 8.5% |
| inn | 373 | 5.1% | 44.6 KB | 5.1% |
| TOTAL: 3 | 7357 | 100.0% | 881.4 KB | 100.0% |
History cache:
| Reason | Count | %Count |
|---|---|---|
| Do not exist | 369 | 50.0% |
| Negative hits | 369 | 50.0% |
| Cache misses | 0 | 0.0% |
| Positive hits | 0 | 0.0% |
| TOTAL: 4 | 738 | 100.0% |
INND timer:
| Code region | Time | Pct | Invoked | Min(ms) | Avg(ms) | Max(ms) |
|---|---|---|---|---|---|---|
| article cancel | 00:00:00.000 | 0.0% | 0 | 0.000 | 0.000 | 0.000 |
| article cleanup | 00:00:00.002 | 0.0% | 370 | 0.000 | 0.005 | 0.500 |
| article logging | 00:00:00.014 | 0.0% | 370 | 0.000 | 0.038 | 0.500 |
| article parse | 00:00:00.003 | 0.0% | 762 | 0.000 | 0.004 | 0.100 |
| article write | 00:00:00.240 | 0.0% | 370 | 0.000 | 0.649 | 7.000 |
| data move | 00:00:00.003 | 0.0% | 404 | 0.000 | 0.007 | 1.000 |
| history grep | 00:00:00.000 | 0.0% | 0 | 0.000 | 0.000 | 0.000 |
| history lookup | 00:00:00.133 | 0.0% | 740 | 0.000 | 0.180 | 1.500 |
| history sync | 00:00:00.053 | 0.0% | 293 | 0.000 | 0.181 | 4.500 |
| history write | 00:00:00.079 | 0.0% | 370 | 0.000 | 0.214 | 1.000 |
| idle | 24:00:39.241 | 100.0% | 4512 | 7601.101 | 19157.633 | 27288.545 |
| nntp read | 00:00:00.013 | 0.0% | 2447 | 0.000 | 0.005 | 0.333 |
| overview write | 00:00:00.166 | 0.0% | 370 | 0.000 | 0.449 | 5.000 |
| perl filter | 00:00:00.001 | 0.0% | 370 | 0.000 | 0.003 | 0.100 |
| python filter | 00:00:00.066 | 0.0% | 740 | 0.000 | 0.089 | 5.667 |
| site send | 00:00:00.000 | 0.0% | 0 | 0.000 | 0.000 | 0.000 |
| TOTAL: 24:00:41.782 | 24:00:40.014 | 100.0% | - | - | - | - |
nnrpd timer:
| Code region | Time | Pct | Invoked | Min(ms) | Avg(ms) | Max(ms) |
|---|---|---|---|---|---|---|
| idle | 02:33:40.807 | 99.7% | 717 | 77.286 | 12860.261 | 27787.357 |
| newnews | 00:00:00.000 | 0.0% | 0 | 0.000 | 0.000 | 0.000 |
| nntpwrite | 00:00:00.031 | 0.0% | 1483 | 0.000 | 0.021 | 0.073 |
| TOTAL: 02:34:04.246 | 02:33:40.838 | 99.7% | - | - | - | - |
Control commands to INND:
| Command | Number |
|---|---|
| flush | 144 |
| flushlogs | 2 |
| go | 2 |
| logmode | 2 |
| lowmark | 1 |
| mode | 149 |
| name | 2 |
| pause | 2 |
| paused | 2 |
| reload | 2 |
| reserve | 2 |
| TOTAL: 11 | 310 |
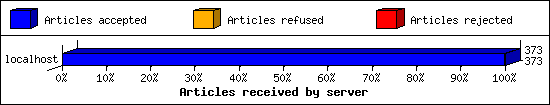
Incoming Feeds (INN):
| Server | Connects | Offered | Taken | Refused | Reject | %Accpt | Elapsed | |
|---|---|---|---|---|---|---|---|---|
| 1 | localhost | 1687 | 373 | 373 | 0 | 0 | 100% | 00:00:01 |
| TOTAL: 1 | 1687 | 373 | 373 | 0 | 0 | 100% | 00:00:01 | |
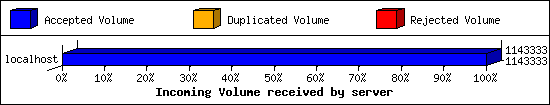
Incoming Volume (INN):
| Server | AcceptVol | DupVol | RejVol | TotalVol | %Acc | Vol/Art | |
|---|---|---|---|---|---|---|---|
| 1 | localhost | 1.1 MB | 0.0 KB | 0.0 KB | 1.1 MB | 100% | 3.0 KB |
| TOTAL: 1 | 1.1 MB | 0.0 KB | 0.0 KB | 1.1 MB | 100% | 3.0 KB | |
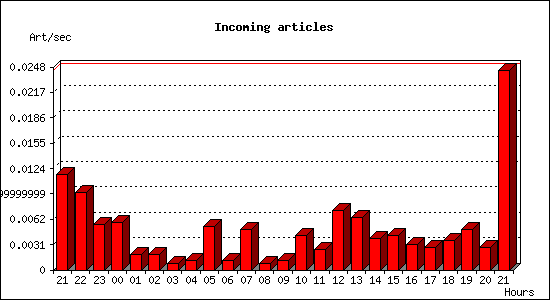
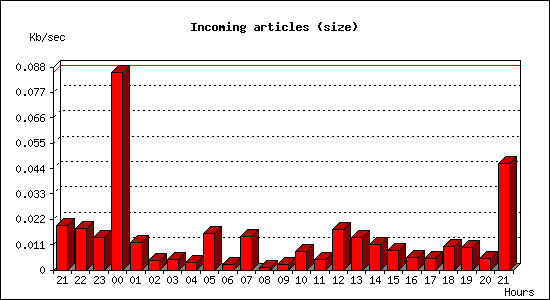
Incoming articles:
| Date | Articles | %Arts | Art/sec | Size | %Size | KB/sec |
|---|---|---|---|---|---|---|
| May 11 21:30:01 - 21:59:59 | 21 | 5.6% | 0.01 | 34.3 KB | 3.1% | 0.02 |
| May 11 22:00:00 - 22:59:59 | 34 | 9.1% | 0.01 | 64.0 KB | 5.7% | 0.02 |
| May 11 23:00:00 - 23:59:59 | 20 | 5.4% | 0.01 | 51.1 KB | 4.6% | 0.01 |
| May 12 00:00:00 - 00:59:59 | 21 | 5.6% | 0.01 | 308.7 KB | 27.6% | 0.09 |
| May 12 01:00:00 - 01:59:59 | 7 | 1.9% | 0.00 | 42.6 KB | 3.8% | 0.01 |
| May 12 02:00:00 - 02:59:59 | 7 | 1.9% | 0.00 | 14.1 KB | 1.3% | 0.00 |
| May 12 03:00:00 - 03:59:59 | 3 | 0.8% | 0.00 | 16.5 KB | 1.5% | 0.00 |
| May 12 04:00:00 - 04:59:59 | 4 | 1.1% | 0.00 | 12.4 KB | 1.1% | 0.00 |
| May 12 05:00:00 - 05:59:59 | 19 | 5.1% | 0.01 | 56.7 KB | 5.1% | 0.02 |
| May 12 06:00:00 - 06:59:59 | 4 | 1.1% | 0.00 | 8.1 KB | 0.7% | 0.00 |
| May 12 07:00:00 - 07:59:59 | 18 | 4.8% | 0.01 | 52.4 KB | 4.7% | 0.01 |
| May 12 08:00:00 - 08:59:59 | 3 | 0.8% | 0.00 | 4.5 KB | 0.4% | 0.00 |
| May 12 09:00:00 - 09:59:59 | 4 | 1.1% | 0.00 | 9.1 KB | 0.8% | 0.00 |
| May 12 10:00:00 - 10:59:59 | 15 | 4.0% | 0.00 | 29.4 KB | 2.6% | 0.01 |
| May 12 11:00:00 - 11:59:59 | 9 | 2.4% | 0.00 | 16.4 KB | 1.5% | 0.00 |
| May 12 12:00:00 - 12:59:59 | 26 | 7.0% | 0.01 | 63.9 KB | 5.7% | 0.02 |
| May 12 13:00:00 - 13:59:59 | 23 | 6.2% | 0.01 | 51.5 KB | 4.6% | 0.01 |
| May 12 14:00:00 - 14:59:59 | 14 | 3.8% | 0.00 | 39.2 KB | 3.5% | 0.01 |
| May 12 15:00:00 - 15:59:59 | 15 | 4.0% | 0.00 | 30.9 KB | 2.8% | 0.01 |
| May 12 16:00:00 - 16:59:59 | 11 | 2.9% | 0.00 | 18.7 KB | 1.7% | 0.01 |
| May 12 17:00:00 - 17:59:59 | 10 | 2.7% | 0.00 | 18.4 KB | 1.6% | 0.01 |
| May 12 18:00:00 - 18:59:59 | 13 | 3.5% | 0.00 | 36.5 KB | 3.3% | 0.01 |
| May 12 19:00:00 - 19:59:59 | 18 | 4.8% | 0.01 | 35.8 KB | 3.2% | 0.01 |
| May 12 20:00:00 - 20:59:59 | 10 | 2.7% | 0.00 | 18.0 KB | 1.6% | 0.01 |
| May 12 21:00:00 - 21:30:02 | 44 | 11.8% | 0.02 | 83.3 KB | 7.5% | 0.05 |
| TOTAL: 24:00:01 | 373 | 100.0% | 0.00 | 1.1 MB | 100.0% | 0.01 |
NNRP readership statistics:
| System | Conn | Arts | Size | Groups | Post | Rej | Elapsed | |
|---|---|---|---|---|---|---|---|---|
| 1 | 167.248.133.45 | 1 | 0 | 0.0 KB | 0 | 0 | 0 | 00:00:01 |
| 2 | 104.152.52.19 | 1 | 0 | 0.0 KB | 0 | 0 | 0 | 00:00:00 |
| 3 | 2607:ff10:c8:594::d | 1 | 0 | 0.0 KB | 0 | 0 | 0 | 00:00:07 |
| 4 | 104.152.52.28 | 1 | 0 | 0.0 KB | 0 | 0 | 0 | 00:00:00 |
| 5 | 104.152.52.76 | 1 | 0 | 0.0 KB | 0 | 0 | 0 | 00:00:00 |
| 6 | 71.6.134.230 | 1 | 0 | 0.0 KB | 0 | 0 | 0 | 00:00:00 |
| 7 | 178.66.21.43 | 1 | 0 | 0.0 KB | 0 | 0 | 0 | 00:00:00 |
| 8 | 2a02:e840:2:0:1d90:62b4:39bd:d6bb | 8 | 0 | 0.0 KB | 0 | 0 | 0 | 02:33:54 |
| TOTAL: 8 | 15 | 0 | 0.0 KB | 0 | 0 | 0 | 02:34:04 | |
NNRP readership statistics (by domain):
| System | Conn | Arts | Size | Groups | Post | Rej | Elapsed | |
|---|---|---|---|---|---|---|---|---|
| 1 | unresolved | 6 | 0 | 0.0 KB | 0 | 0 | 0 | 00:00:02 |
| 2 | ? | 9 | 0 | 0.0 KB | 0 | 0 | 0 | 02:34:01 |
| TOTAL: 2 | 15 | 0 | 0.0 KB | 0 | 0 | 0 | 02:34:04 | |
NNRP auth users [Top 20]:
| User | Conn |
|---|---|
| denis | 8 |
| TOTAL: 1 | 8 |
NNRP total resource statistics [Top 20]:
| System | User(ms) | System(ms) | Idle(ms) | Elapsed |
|---|---|---|---|---|
| 2a02:e840:2:0:1d90:62b4:39bd:d6bb | 0.093 | 0.108 | 0.037 | 02:33:54 |
| 2607:ff10:c8:594::d | 0.010 | 0.005 | 0.000 | 00:00:07 |
| 167.248.133.45 | 0.015 | 0.008 | 0.000 | 00:00:01 |
| 178.66.21.43 | 0.011 | 0.010 | 0.000 | 00:00:00 |
| 71.6.134.230 | 0.005 | 0.010 | 0.000 | 00:00:00 |
| 104.152.52.76 | 0.006 | 0.003 | 0.000 | 00:00:00 |
| 104.152.52.19 | 0.006 | 0.003 | 0.000 | 00:00:00 |
| 104.152.52.28 | 0.005 | 0.005 | 0.000 | 00:00:00 |
| ? | 0.018 | 0.013 | 0.000 | 00:00:00 |
| TOTAL: 9 | 0.169 | 0.165 | 0.037 | 02:34:04 |
NNRP gethostbyaddr failures [Top 20]:
| System | Conn |
|---|---|
| ? (can't getpeername) | 3 |
| TOTAL: 1 | 3 |
NNRP unrecognized commands (by host):
| System | Conn |
|---|---|
| 167.248.133.45 | 1 |
| TOTAL: 1 | 1 |
NNRP unrecognized commands (by command):
| Command | Count |
|---|---|
| EHLO www.censys.io | 1 |
| TOTAL: 1 | 1 |
NNRP client timeouts [Top 20]:
| System | Conn | Peer |
|---|---|---|
| 2a02:e840:2:0:1d90:62b4:39bd:d6bb | 2 | 0 |
| TOTAL: 1 | 2 | 0 |