Unknown entries from news log file:
First 4 / 4 lines (100.0%)
Log entries by program:
| Program name | Lines | %Lines | Size | %Size |
|---|---|---|---|---|
| innd | 6143 | 87.5% | 748.4 KB | 88.3% |
| nnrpd | 542 | 7.7% | 58.7 KB | 6.9% |
| inn | 339 | 4.8% | 40.6 KB | 4.8% |
| TOTAL: 3 | 7024 | 100.0% | 847.7 KB | 100.0% |
History cache:
| Reason | Count | %Count |
|---|---|---|
| Do not exist | 339 | 50.0% |
| Negative hits | 339 | 50.0% |
| Positive hits | 0 | 0.0% |
| Cache misses | 0 | 0.0% |
| TOTAL: 4 | 678 | 100.0% |
INND timer:
| Code region | Time | Pct | Invoked | Min(ms) | Avg(ms) | Max(ms) |
|---|---|---|---|---|---|---|
| article cancel | 00:00:00.000 | 0.0% | 0 | 0.000 | 0.000 | 0.000 |
| article cleanup | 00:00:00.001 | 0.0% | 339 | 0.000 | 0.003 | 0.100 |
| article logging | 00:00:00.013 | 0.0% | 339 | 0.000 | 0.038 | 1.000 |
| article parse | 00:00:00.004 | 0.0% | 682 | 0.000 | 0.006 | 0.125 |
| article write | 00:00:00.217 | 0.0% | 339 | 0.000 | 0.640 | 6.500 |
| data move | 00:00:00.001 | 0.0% | 344 | 0.000 | 0.003 | 0.250 |
| history grep | 00:00:00.000 | 0.0% | 0 | 0.000 | 0.000 | 0.000 |
| history lookup | 00:00:00.110 | 0.0% | 678 | 0.000 | 0.162 | 3.250 |
| history sync | 00:00:00.042 | 0.0% | 399 | 0.000 | 0.105 | 2.333 |
| history write | 00:00:00.056 | 0.0% | 339 | 0.000 | 0.165 | 1.000 |
| idle | 24:01:14.515 | 100.0% | 4523 | 6903.069 | 19118.840 | 26129.217 |
| nntp read | 00:00:00.010 | 0.0% | 2335 | 0.000 | 0.004 | 0.077 |
| overview write | 00:00:00.136 | 0.0% | 339 | 0.000 | 0.401 | 3.000 |
| perl filter | 00:00:00.001 | 0.0% | 339 | 0.000 | 0.003 | 0.500 |
| python filter | 00:00:00.036 | 0.0% | 678 | 0.000 | 0.053 | 2.000 |
| site send | 00:00:00.000 | 0.0% | 0 | 0.000 | 0.000 | 0.000 |
| TOTAL: 24:01:17.863 | 24:01:15.142 | 100.0% | - | - | - | - |
nnrpd timer:
| Code region | Time | Pct | Invoked | Min(ms) | Avg(ms) | Max(ms) |
|---|---|---|---|---|---|---|
| idle | 01:11:39.869 | 100.0% | 511 | 0.000 | 8414.616 | 89200.000 |
| newnews | 00:00:00.000 | 0.0% | 0 | 0.000 | 0.000 | 0.000 |
| nntpwrite | 00:00:00.026 | 0.0% | 3151 | 0.000 | 0.008 | 0.067 |
| readart | 00:00:00.015 | 0.0% | 22 | 0.500 | 0.682 | 1.500 |
| TOTAL: 01:11:41.338 | 01:11:39.910 | 100.0% | - | - | - | - |
Control commands to INND:
| Command | Number |
|---|---|
| flush | 145 |
| flushlogs | 2 |
| go | 2 |
| logmode | 3 |
| lowmark | 1 |
| mode | 150 |
| name | 3 |
| pause | 2 |
| paused | 2 |
| reload | 2 |
| reserve | 2 |
| TOTAL: 11 | 314 |
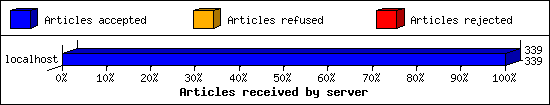
Incoming Feeds (INN):
| Server | Connects | Offered | Taken | Refused | Reject | %Accpt | Elapsed | |
|---|---|---|---|---|---|---|---|---|
| 1 | localhost | 1651 | 339 | 339 | 0 | 0 | 100% | 00:00:02 |
| TOTAL: 1 | 1651 | 339 | 339 | 0 | 0 | 100% | 00:00:02 | |
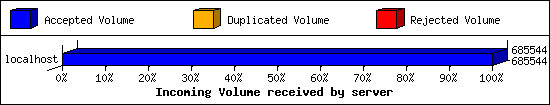
Incoming Volume (INN):
| Server | AcceptVol | DupVol | RejVol | TotalVol | %Acc | Vol/Art | |
|---|---|---|---|---|---|---|---|
| 1 | localhost | 669.5 KB | 0.0 KB | 0.0 KB | 669.5 KB | 100% | 2.0 KB |
| TOTAL: 1 | 669.5 KB | 0.0 KB | 0.0 KB | 669.5 KB | 100% | 2.0 KB | |
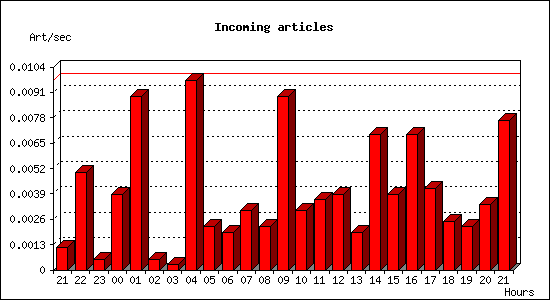
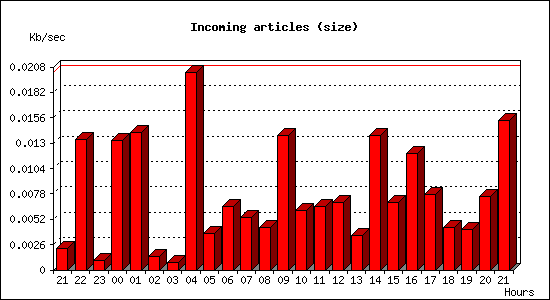
Incoming articles:
| Date | Articles | %Arts | Art/sec | Size | %Size | KB/sec |
|---|---|---|---|---|---|---|
| May 24 21:30:26 - 21:59:59 | 2 | 0.6% | 0.00 | 4.0 KB | 0.6% | 0.00 |
| May 24 22:00:00 - 22:59:59 | 18 | 5.3% | 0.01 | 48.1 KB | 7.2% | 0.01 |
| May 24 23:00:00 - 23:59:59 | 2 | 0.6% | 0.00 | 3.3 KB | 0.5% | 0.00 |
| May 25 00:00:00 - 00:59:59 | 14 | 4.1% | 0.00 | 47.7 KB | 7.1% | 0.01 |
| May 25 01:00:00 - 01:59:59 | 32 | 9.4% | 0.01 | 50.7 KB | 7.6% | 0.01 |
| May 25 02:00:00 - 02:59:59 | 2 | 0.6% | 0.00 | 4.8 KB | 0.7% | 0.00 |
| May 25 03:00:00 - 03:59:59 | 1 | 0.3% | 0.00 | 2.6 KB | 0.4% | 0.00 |
| May 25 04:00:00 - 04:59:59 | 35 | 10.3% | 0.01 | 73.0 KB | 10.9% | 0.02 |
| May 25 05:00:00 - 05:59:59 | 8 | 2.4% | 0.00 | 13.6 KB | 2.0% | 0.00 |
| May 25 06:00:00 - 06:59:59 | 7 | 2.1% | 0.00 | 23.5 KB | 3.5% | 0.01 |
| May 25 07:00:00 - 07:59:59 | 11 | 3.2% | 0.00 | 19.3 KB | 2.9% | 0.01 |
| May 25 08:00:00 - 08:59:59 | 8 | 2.4% | 0.00 | 15.6 KB | 2.3% | 0.00 |
| May 25 09:00:00 - 09:59:59 | 32 | 9.4% | 0.01 | 49.5 KB | 7.4% | 0.01 |
| May 25 10:00:00 - 10:59:59 | 11 | 3.2% | 0.00 | 22.0 KB | 3.3% | 0.01 |
| May 25 11:00:00 - 11:59:59 | 13 | 3.8% | 0.00 | 23.4 KB | 3.5% | 0.01 |
| May 25 12:00:00 - 12:59:59 | 14 | 4.1% | 0.00 | 24.9 KB | 3.7% | 0.01 |
| May 25 13:00:00 - 13:59:59 | 7 | 2.1% | 0.00 | 12.6 KB | 1.9% | 0.00 |
| May 25 14:00:00 - 14:59:59 | 25 | 7.4% | 0.01 | 49.4 KB | 7.4% | 0.01 |
| May 25 15:00:00 - 15:59:59 | 14 | 4.1% | 0.00 | 25.0 KB | 3.7% | 0.01 |
| May 25 16:00:00 - 16:59:59 | 25 | 7.4% | 0.01 | 42.8 KB | 6.4% | 0.01 |
| May 25 17:00:00 - 17:59:59 | 15 | 4.4% | 0.00 | 27.8 KB | 4.2% | 0.01 |
| May 25 18:00:00 - 18:59:59 | 9 | 2.7% | 0.00 | 15.5 KB | 2.3% | 0.00 |
| May 25 19:00:00 - 19:59:59 | 8 | 2.4% | 0.00 | 15.0 KB | 2.2% | 0.00 |
| May 25 20:00:00 - 20:59:59 | 12 | 3.5% | 0.00 | 27.3 KB | 4.1% | 0.01 |
| May 25 21:00:00 - 21:30:26 | 14 | 4.1% | 0.01 | 28.0 KB | 4.2% | 0.02 |
| TOTAL: 24:00:00 | 339 | 100.0% | 0.00 | 669.5 KB | 100.0% | 0.01 |
NNRP readership statistics:
| System | Conn | Arts | Size | Groups | Post | Rej | Elapsed | |
|---|---|---|---|---|---|---|---|---|
| 1 | 79-139-142-135.dynamic.spd-mgts.ru | 26 | 22 | 53.4 KB | 10 | 0 | 0 | 01:11:35 |
| TOTAL: 1 | 26 | 22 | 53.4 KB | 10 | 0 | 0 | 01:11:41 | |
NNRP readership statistics (by domain):
| System | Conn | Arts | Size | Groups | Post | Rej | Elapsed | |
|---|---|---|---|---|---|---|---|---|
| 1 | *.dynamic.spd-mgts.ru | 26 | 22 | 53.4 KB | 10 | 0 | 0 | 01:11:35 |
| 2 | *.static.ip.netia.com.pl | 6 | 0 | 0.0 KB | 0 | 0 | 0 | 00:00:00 |
| 3 | *.ip.linodeusercontent.com | 8 | 0 | 0.0 KB | 0 | 0 | 0 | 00:00:02 |
| 4 | unresolved | 2 | 0 | 0.0 KB | 0 | 0 | 0 | 00:00:03 |
| TOTAL: 4 | 42 | 22 | 53.4 KB | 10 | 0 | 0 | 01:11:41 | |
NNRP total resource statistics [Top 20]:
| System | User(ms) | System(ms) | Idle(ms) | Elapsed |
|---|---|---|---|---|
| 79-139-142-135.dynamic.spd-mgts.ru | 0.197 | 0.227 | 0.000 | 01:11:35 |
| 178.70.89.111 | 0.008 | 0.009 | 0.000 | 00:00:02 |
| 172-233-57-39.ip.linodeusercontent.com | 0.069 | 0.034 | 0.000 | 00:00:02 |
| 78-11-84-52.static.ip.netia.com.pl | 0.031 | 0.027 | 0.000 | 00:00:00 |
| 104.152.52.37 | 0.005 | 0.006 | 0.000 | 00:00:00 |
| ? | 0.004 | 0.006 | 0.000 | 00:00:00 |
| TOTAL: 6 | 0.314 | 0.309 | 0.000 | 01:11:41 |
Curious NNRP server explorers [Top 20]:
| System | Conn |
|---|---|
| 172-233-57-39.ip.linodeusercontent.com | 8 |
| 78-11-84-52.static.ip.netia.com.pl | 6 |
| 104.152.52.37 | 1 |
| 178.70.89.111 | 1 |
| TOTAL: 4 | 16 |
NNRP gethostbyaddr failures [Top 20]:
| System | Conn |
|---|---|
| ? (can't getpeername) | 1 |
| TOTAL: 1 | 1 |
NNRP unrecognized commands (by host):
| System | Conn |
|---|---|
| 78-11-84-52.static.ip.netia.com.pl | 30 |
| 172-233-57-39.ip.linodeusercontent.com | 4 |
| TOTAL: 2 | 34 |
NNRP unrecognized commands (by command):
| Command | Count |
|---|---|
| Connection: close | 5 |
| Accept: */* | 5 |
| Accept-Encoding: gzip, deflate | 5 |
| User-Agent: Opera/9.80 (Windows NT 6.1; ... | 5 |
| Host: 37.46.134.137:119 | 5 |
| À#024 | 1 |
| GET /login.rsp HTTP/1.1 | 1 |
| GET /favicon.ico HTTP/1.1 | 1 |
| GET /image/lgbg.jpg HTTP/1.1 | 1 |
| #026#003#001 | 1 |
| #010#013#010#004#010#005#010#006#004#001#005#001#006#001#003#003#002#003#003#001#002#001#003#002#002#002#004#002#005#002#006#002 | 1 |
| GET / HTTP/1.1 | 1 |
| GET /skin/default_1/images/logo.png HTTP... | 1 |
| #026#003#001#002 | 1 |
| TOTAL: 14 | 34 |
NNRP client timeouts [Top 20]:
| System | Conn | Peer |
|---|---|---|
| 79-139-142-135.dynamic.spd-mgts.ru | 2 | 2 |
| 172-233-57-39.ip.linodeusercontent.com | 1 | 1 |
| TOTAL: 2 | 3 | 3 |
Newsgroup request counts (by category):
| Category | Count | Pct | |
|---|---|---|---|
| 1 | fido7 | 22 | 100.0% |
| TOTAL: 1 | 22 | 100.0% | |
Newsgroup request counts (by newsgroup) [Top 100]:
| Newsgroup | Count | |
|---|---|---|
| 1 | fido7.su.humor | 8 |
| 2 | fido7.ru.mac | 5 |
| 3 | fido7.mo.echo | 4 |
| 4 | fido7.n5020.crisis | 1 |
| 5 | fido7.ru.atheism | 1 |
| 6 | fido7.ru.podmoskovie.talks | 1 |
| 7 | fido7.mo.tourism | 1 |
| 8 | fido7.ru.c-- | 1 |
| TOTAL: 8 | 22 | |